


Updated August 4th, 2019 by Ben Reynolds
Spreadsheet and table data updated weekly on Wednesdays
The S&P 500 Index is the most widely used gauge of performance for large-capitalization U.S. companies. The S&P 500 is often used as a proxy for ‘the market’.
The index contains the 500 largest stocks by market capitalization (that also meet other criteria).
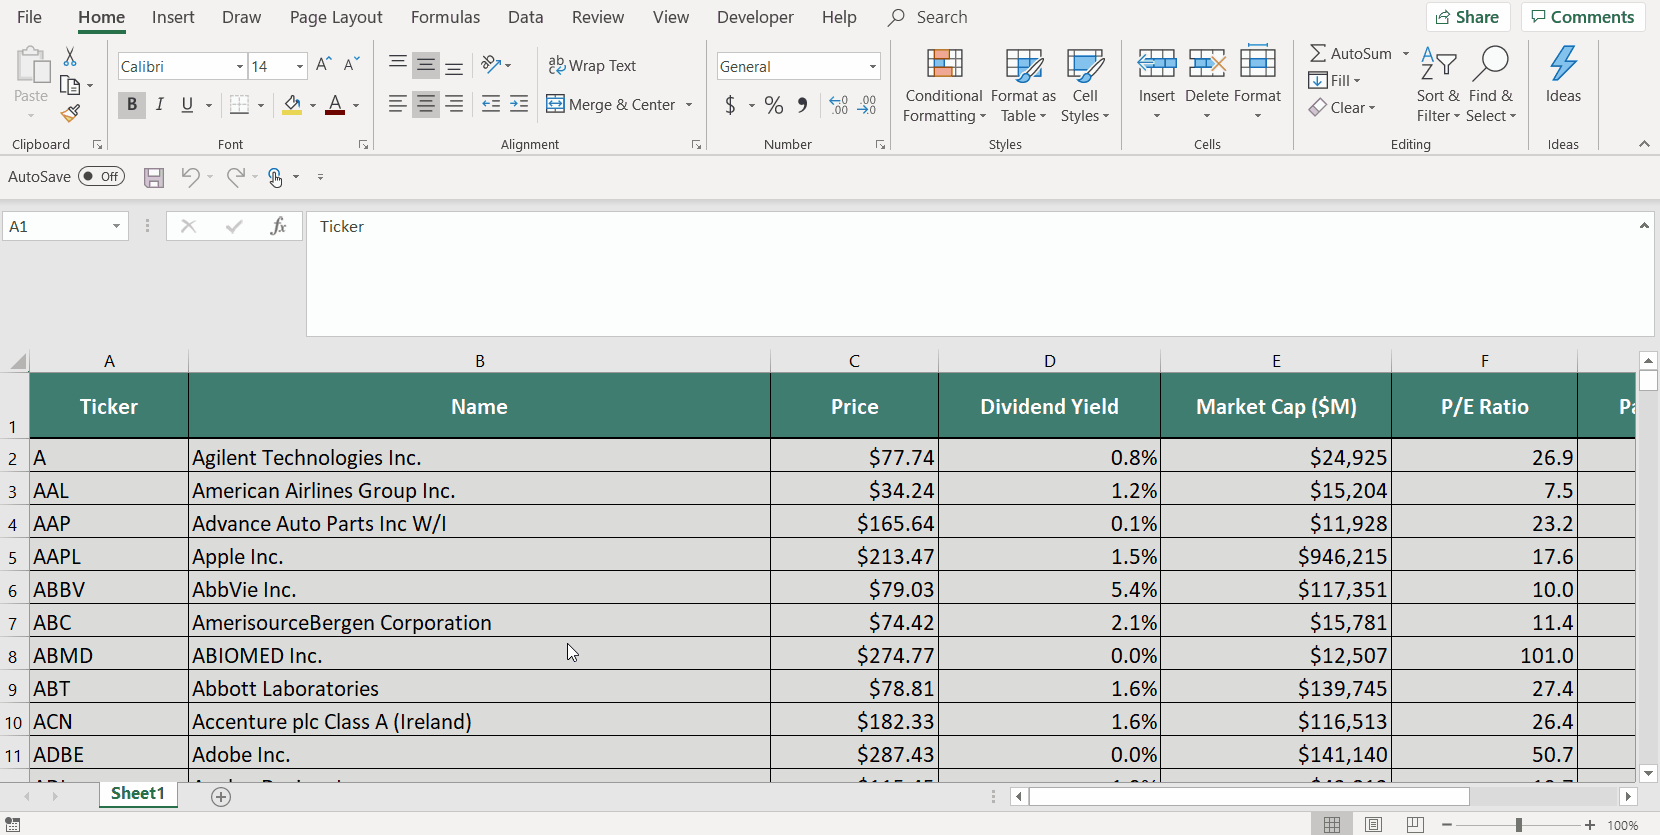
The spreadsheet available for download above contains numerous important investing metrics, including:
- Dividend yield
- Price-to-earnings ratio
- Market Capitalization
You can view a preview of the spreadsheet below:
| A | 70.58 | 0.9 | 22,166.9 | 20.1 | 17.9 |
| AAL | 30.58 | 1.3 | 13,674.3 | 9.2 | 12.0 |
| AAP | 152.00 | 0.2 | 10,889.7 | 25.9 | 4.1 |
| AAPL | 218.25 | 1.4 | 960,613.5 | 18.4 | 26.2 |
| ABBV | 67.03 | 6.2 | 99,316.9 | ||
| ABC | 86.75 | 1.8 | 18,646.9 | 20.0 | 35.2 |
| ABMD | 283.65 | 0.0 | 12,644.4 | 49.1 | 0.0 |
| ABT | 87.88 | 1.4 | 155,794.7 | ||
| ACN | 195.47 | 1.4 | 124,656.6 | 26.7 | 38.0 |
| ADBE | 304.03 | 0.0 | 147,398.7 | 56.0 | 0.0 |
| ADI | 119.85 | 1.6 | 44,726.3 | 28.4 | 46.5 |
| ADM | 41.02 | 3.3 | 22,938.8 | 14.0 | 46.4 |
| ADP | 168.48 | 1.8 | 71,812.6 | 38.0 | 68.2 |
| ADS | 158.05 | 1.5 | 8,061.4 | 9.8 | 14.8 |
| ADSK | 159.40 | 0.0 | 35,202.9 | -1,518.0 | 0.0 |
| AEE | 76.45 | 2.4 | 18,716.9 | 21.9 | 53.5 |
| AEP | 88.80 | 3.0 | 43,809.5 | 22.2 | 65.7 |
| AES | 17.08 | 3.1 | 11,382.9 | 16.9 | 52.4 |
| AFL | 52.89 | 2.0 | 39,151.5 | 12.8 | 25.7 |
| AGN | 161.05 | 1.8 | 52,737.0 | -7.5 | -13.5 |
| AIG | 56.71 | 2.3 | 48,984.5 | -177.2 | -402.7 |
| AIV | 50.01 | 3.2 | 7,445.9 | 26.3 | 82.9 |
| AIZ | 114.15 | 2.0 | 7,045.6 | 24.1 | 48.7 |
| AJG | 92.08 | 1.8 | 17,083.1 | 24.6 | 45.1 |
| AKAM | 89.97 | 0.0 | 13,789.1 | 34.8 | 0.0 |
| ALB | 73.62 | 1.9 | 7,798.4 | 11.4 | 21.3 |
| ALGN | 210.40 | 0.0 | 16,261.0 | 40.3 | 0.0 |
| ALK | 64.37 | 2.1 | 7,894.9 | 15.7 | 32.9 |
| ALL | 108.02 | 1.8 | 33,920.3 | 15.2 | 28.0 |
| ALLE | 104.76 | 0.9 | 9,736.3 | 22.6 | 20.8 |
| ALXN | 115.21 | 0.0 | 25,662.8 | 19.3 | 0.0 |
| AMAT | 49.93 | 1.6 | 47,488.6 | 13.9 | 22.1 |
| AMD | 31.39 | 0.0 | 36,633.8 | 169.4 | 0.0 |
| AME | 90.94 | 0.6 | 20,676.6 | 25.3 | 15.6 |
| AMG | 85.57 | 1.4 | 4,443.0 | -37.4 | -53.5 |
| AMGN | 183.51 | 3.1 | 107,623.2 | 14.4 | 45.3 |
| AMP | 147.08 | 2.5 | 19,888.8 | 10.7 | 26.4 |
| AMT | 211.63 | 1.6 | 92,228.1 | 69.4 | 109.7 |
| AMZN | 1,891.20 | 0.0 | 939,119.3 | 76.7 | 0.0 |
| ANET | 277.92 | 0.0 | 21,016.2 | 54.9 | 0.0 |
| ANSS | 207.26 | 0.0 | 17,440.2 | 41.3 | 0.0 |
| ANTM | 300.95 | 1.0 | 76,653.0 | 19.0 | 19.7 |
| AON | 191.65 | 0.8 | 45,557.6 | 34.3 | 29.1 |
| AOS | 45.64 | 1.9 | 6,392.1 | ||
| APA | 24.36 | 4.1 | 9,059.7 | -60.1 | -249.6 |
| APC | 73.82 | 1.6 | 37,197.8 | -61.8 | -96.0 |
| APD | 230.60 | 1.9 | 51,080.5 | 29.7 | 57.9 |
| APH | 94.06 | 1.0 | 28,186.2 | 23.2 | 22.5 |
| APTV | 85.91 | 1.1 | 21,031.6 | 22.6 | 24.4 |
| ARE | 147.32 | 0.0 | 16,806.5 | 42.0 | 0.0 |
| ARNC | 25.20 | 1.0 | 11,086.7 | 17.7 | 16.9 |
| ATVI | 49.83 | 0.7 | 36,990.5 | 21.6 | 15.2 |
| AVB | 211.88 | 2.8 | 29,394.5 | 29.3 | 82.3 |
| AVGO | 296.32 | 2.9 | 119,247.0 | 35.3 | 103.6 |
| AVY | 116.05 | 1.8 | 9,799.9 | 41.5 | 76.4 |
| AWK | 115.25 | 1.6 | 20,779.5 | 36.3 | 58.8 |
| AXP | 125.78 | 1.2 | 104,928.9 | 15.5 | 19.2 |
| AZO | 1,134.08 | 0.0 | 28,066.1 | 19.9 | 0.0 |
| BA | 345.90 | 2.2 | 195,519.2 | 39.8 | 86.3 |
| BAC | 30.75 | 1.9 | 287,533.4 | 10.8 | 21.0 |
| BAX | 85.38 | 0.9 | 43,956.1 | 28.2 | 25.9 |
| BBT | 51.32 | 3.2 | 39,365.3 | 12.5 | 39.6 |
| BBY | 77.07 | 2.4 | 20,562.3 | 13.7 | 33.0 |
| BDX | 255.67 | 1.2 | 69,598.9 | 73.9 | 87.1 |
| BEN | 33.61 | 3.0 | 17,039.1 | 12.4 | 37.1 |
| BF.B | 54.81 | 1.2 | 26,311.8 | 31.4 | 37.0 |
| BHF | 39.18 | 0.0 | 4,544.4 | 24.3 | 0.0 |
| BHGE | 25.90 | 2.9 | 25,432.1 | 80.9 | 237.8 |
| BIIB | 239.87 | 0.0 | 44,545.8 | 8.9 | 0.0 |
| BK | 46.77 | 2.4 | 44,342.8 | 12.1 | 28.8 |
| BKNG | 1,895.13 | 0.0 | 82,971.1 | 21.4 | 0.0 |
| BLK | 474.84 | 2.7 | 74,329.1 | 17.9 | 48.1 |
| BLL | 72.15 | 0.5 | 24,362.7 | 55.1 | 30.3 |
| BMY | 44.91 | 3.7 | 72,889.9 | 11.8 | 43.1 |
| BR | 129.00 | 1.4 | 15,242.1 | 29.7 | 41.2 |
| BRK.B | 208.35 | 0.0 | 509,703.9 | 19.1 | 0.0 |
| BSX | 42.86 | 0.0 | 59,603.3 | 42.4 | 0.0 |
| BWA | 37.98 | 1.8 | 7,864.1 | 10.3 | 18.3 |
| BXP | 134.86 | 2.9 | 20,552.7 | 39.4 | 112.7 |
| C | 71.22 | 2.5 | 162,000.1 | 9.9 | 24.8 |
| CAG | 29.21 | 2.9 | 14,146.4 | 19.2 | 56.1 |
| CAH | 45.57 | 4.1 | 13,833.0 | 399.7 | 1,641.0 |
| CAT | 133.37 | 2.6 | 76,030.9 | 12.3 | 31.8 |
| CB | 153.69 | 1.9 | 70,196.2 | ||
| CBOE | 110.38 | 1.1 | 12,350.7 | 30.8 | 33.5 |
| CBRE | 53.18 | 0.0 | 17,886.6 | 16.7 | 0.0 |
| CBS | 51.74 | 1.4 | 19,692.6 | 6.4 | 8.8 |
| CCI | 133.35 | 3.3 | 55,194.9 | 76.8 | 256.2 |
| CCL | 47.39 | 4.2 | 24,962.2 | 11.1 | 46.9 |
| CDNS | 75.59 | 0.0 | 21,162.8 | 48.6 | 0.0 |
| CE | 112.32 | 2.0 | 13,923.2 | 14.0 | 27.8 |
| CELG | 92.70 | 0.0 | 65,314.1 | 12.4 | 0.0 |
| CERN | 72.75 | 0.2 | 23,430.6 | 40.0 | 9.8 |
| CF | 49.71 | 2.4 | 10,996.4 | 36.1 | 87.0 |
| CFG | 37.35 | 3.1 | 17,235.5 | 10.0 | 31.2 |
| CHD | 77.27 | 1.1 | 18,867.8 | 32.3 | 37.1 |
| CHRW | 82.76 | 2.3 | 11,576.4 | 16.4 | 38.0 |
| CHTR | 389.02 | 0.0 | 87,386.4 | 64.9 | 0.0 |
| CI | 170.20 | 0.0 | 65,361.6 | 16.0 | 0.4 |
| CINF | 107.80 | 2.1 | 17,270.4 | 14.4 | 29.6 |
| CL | 72.97 | 2.3 | 64,127.4 | 27.7 | 62.7 |
| CLX | 165.45 | 2.3 | 21,037.4 | 26.7 | 62.1 |
| CMA | 72.68 | 3.5 | 10,969.6 | 9.2 | 32.0 |
| CMCSA | 43.66 | 1.8 | 200,342.9 | 16.4 | 29.8 |
| CME | 194.44 | 1.4 | 70,632.0 | 36.2 | 52.3 |
| CMG | 792.38 | 0.0 | 22,323.9 | 88.2 | 0.0 |
| CMI | 165.40 | 2.8 | 26,013.0 | 10.1 | 27.8 |
| CMS | 58.80 | 2.5 | 16,618.6 | 28.5 | 72.1 |
| CNC | 53.42 | 0.0 | 22,251.9 | 17.3 | 0.0 |
| CNP | 28.83 | 3.9 | 14,482.7 | 45.1 | 175.0 |
| COF | 92.89 | 1.8 | 42,896.1 | 8.0 | 14.0 |
| COG | 19.04 | 1.5 | 8,087.5 | 9.7 | 14.5 |
| COO | 338.30 | 0.0 | 16,879.9 | 39.0 | 0.7 |
| COP | 59.19 | 2.0 | 67,257.0 | 9.5 | 19.1 |
| COST | 279.19 | 0.8 | 122,921.0 | 34.0 | 28.7 |
| COTY | 11.13 | 4.5 | 8,408.1 | -7.1 | -31.9 |
| CPB | 41.60 | 3.4 | 12,545.9 | 34.8 | 117.1 |
| CPRI | 35.65 | 0.0 | 5,408.1 | 9.8 | 0.0 |
| CPRT | 78.12 | 0.0 | 17,829.6 | 32.9 | 0.0 |
| CRM | 157.60 | 0.0 | 122,252.7 | 103.9 | 0.0 |
| CSCO | 56.75 | 2.4 | 241,732.8 | 19.4 | 46.1 |
| CSX | 70.86 | 1.3 | 56,039.9 | 17.0 | 22.2 |
| CTAS | 262.62 | 0.8 | 26,938.7 | 31.7 | 24.8 |
| CTL | 12.26 | 15.4 | 13,203.7 | -1.6 | -25.2 |
| CTSH | 65.90 | 1.2 | 37,191.3 | 18.9 | 23.1 |
| CTXS | 95.24 | 1.1 | 12,524.1 | 24.0 | 26.5 |
| CVS | 56.06 | 3.5 | 73,437.6 | -127.4 | -450.7 |
| CVX | 124.05 | 3.7 | 236,856.5 | 17.0 | 62.2 |
| CXO | 98.66 | 0.1 | 19,644.2 | 25.0 | 3.2 |
| D | 74.23 | 4.6 | 60,201.4 | 35.2 | 160.5 |
| DAL | 61.52 | 2.2 | 40,722.1 | 9.1 | 20.4 |
| DE | 168.97 | 1.7 | 53,898.8 | 16.3 | 27.7 |
| DFS | 90.41 | 1.8 | 29,475.5 | 10.6 | 18.6 |
| DG | 134.35 | 0.9 | 34,666.9 | 21.9 | 19.4 |
| DGX | 103.04 | 2.0 | 13,958.5 | 19.2 | 38.6 |
| DHI | 46.64 | 1.2 | 17,360.2 | 11.1 | 13.7 |
| DHR | 142.28 | 0.5 | 102,368.4 | 41.1 | 19.0 |
| DIS | 143.96 | 1.2 | 260,830.5 | 16.1 | 19.1 |
| DISCA | 30.63 | 0.0 | 16,282.9 | 22.3 | 0.0 |
| DISCK | 28.52 | 0.0 | 15,154.3 | 20.8 | 0.0 |
| DISH | 34.63 | 0.0 | 16,425.2 | 11.4 | 0.0 |
| DLR | 114.88 | 3.7 | 23,744.3 | 96.2 | 352.8 |
| DLTR | 102.32 | 0.0 | 24,111.9 | -16.4 | 0.0 |
| DOV | 97.10 | 2.0 | 14,236.9 | 23.5 | 46.1 |
| DRE | 33.67 | 2.5 | 12,211.6 | 34.3 | 84.5 |
| DRI | 122.49 | 2.4 | 15,345.6 | 21.2 | 51.0 |
| DTE | 127.67 | 0.0 | 23,442.0 | 21.0 | 0.0 |
| DUK | 87.37 | 4.2 | 63,878.8 | 21.2 | 88.9 |
| DVA | 60.02 | 0.0 | 9,631.6 | 81.1 | 0.0 |
| DVN | 27.48 | 1.2 | 11,160.6 | 4.5 | 5.5 |
| DWDP | 30.52 | 5.0 | 68,559.8 | 21.5 | 107.0 |
| DXC | 56.41 | 1.3 | 15,109.8 | 12.4 | 16.7 |
| EA | 95.44 | 0.0 | 26,248.5 | 13.3 | 0.0 |
| EBAY | 41.41 | 0.7 | 34,708.1 | 16.0 | 10.8 |
| ECL | 205.21 | 0.9 | 59,285.6 | 39.5 | 34.4 |
| ED | 85.52 | 3.4 | 27,934.5 | 19.6 | 66.1 |
| EFX | 140.51 | 1.1 | 17,093.0 | -39.9 | -44.0 |
| EIX | 73.02 | 3.5 | 22,894.7 | -95.9 | -333.4 |
| EL | 186.80 | 0.9 | 68,386.7 | 37.5 | 32.1 |
| EMN | 76.29 | 3.2 | 10,509.3 | ||
| EMR | 65.99 | 2.9 | 41,357.8 | 17.8 | 51.6 |
| EOG | 87.39 | 1.0 | 49,942.8 | 14.8 | 14.5 |
| EQIX | 501.95 | 1.9 | 41,935.8 | 96.2 | 179.3 |
| EQR | 80.28 | 2.8 | 29,472.4 | 47.3 | 131.6 |
| ES | 76.61 | 2.7 | 24,573.9 | 22.7 | 60.8 |
| ESS | 307.04 | 2.5 | 20,157.5 | 49.4 | 122.7 |
| ETFC | 48.68 | 0.9 | 11,751.1 | 11.9 | 10.2 |
| ETN | 82.55 | 3.3 | 34,910.4 | 16.0 | 52.7 |
| ETR | 105.26 | 3.5 | 19,729.5 | 19.8 | 68.7 |
| EVRG | 60.89 | 3.0 | 14,846.0 | 26.0 | 77.3 |
| EW | 216.48 | 0.0 | 45,102.2 | 62.4 | 0.0 |
| EXC | 45.72 | 3.0 | 44,712.5 | 19.0 | 57.6 |
| EXPD | 76.83 | 1.2 | 13,114.7 | 21.4 | 25.2 |
| EXPE | 134.22 | 0.9 | 20,237.9 | 32.3 | 30.6 |
| EXR | 113.33 | 3.1 | 14,262.1 | 33.4 | 103.8 |
| F | 9.56 | 6.3 | 38,104.4 | 17.3 | 108.9 |
| FANG | 103.61 | 0.5 | 16,933.2 | 16.2 | 7.9 |
| FAST | 31.48 | 2.6 | 18,126.1 | 23.6 | 61.9 |
| FB | 196.68 | 0.0 | 562,099.9 | 33.1 | 0.0 |
| FBHS | 55.70 | 1.5 | 7,829.1 | 19.9 | 29.1 |
| FCX | 11.38 | 1.7 | 16,638.8 | 25.5 | 44.4 |
| FDX | 172.46 | 1.5 | 44,960.7 | 86.4 | 130.3 |
| FE | 44.32 | 3.3 | 23,667.5 | 21.3 | 70.9 |
| FFIV | 149.46 | 0.0 | 9,012.1 | 19.3 | 0.0 |
| FIS | 134.93 | 1.0 | 43,293.9 | 54.2 | 53.1 |
| FISV | 105.95 | 0.0 | 40,833.8 | 43.7 | 0.0 |
| FITB | 29.68 | 2.9 | 21,875.1 | 10.0 | 28.7 |
| FL | 41.38 | 3.4 | 4,609.6 | 8.6 | 28.9 |
| FLIR | 50.61 | 1.3 | 6,841.5 | 24.7 | 32.3 |
| FLR | 33.28 | 2.5 | 4,620.4 | 25.5 | 64.8 |
| FLS | 50.84 | 1.5 | 6,739.2 | 41.1 | 60.8 |
| FLT | 287.08 | 0.0 | 24,453.8 | 31.2 | 0.0 |
| FMC | 86.00 | 1.6 | 11,164.6 | 22.1 | 35.6 |
| FOX | 37.54 | 0.0 | 23,486.9 | ||
| FOXA | 37.48 | 0.0 | 23,468.3 | 14.4 | 0.0 |
| FRC | 99.11 | 0.7 | 16,787.4 | 19.7 | 14.3 |
| FRT | 132.33 | 3.1 | 9,936.7 | 43.6 | 134.7 |
| FTI | 27.86 | 1.9 | 12,527.8 | -6.3 | -11.7 |
| FTNT | 82.38 | 0.0 | 14,077.5 | 40.1 | 0.0 |
| FTV | 76.31 | 0.4 | 25,768.9 | 9.8 | 3.6 |
| GD | 188.00 | 2.1 | 54,626.2 | 16.5 | 34.1 |
| GE | 10.07 | 2.5 | 91,742.9 | -4.2 | -10.5 |
| GILD | 65.95 | 3.6 | 85,309.0 | 14.2 | 50.8 |
| GIS | 53.54 | 3.7 | 32,313.2 | 18.4 | 67.1 |
| GLW | 31.00 | 2.4 | 24,641.3 | 17.4 | 42.1 |
| GM | 40.40 | 3.8 | 57,345.5 | 6.3 | 23.8 |
| GOOG | 1,226.25 | 0.0 | 849,538.2 | ||
| GOOGL | 1,227.36 | 0.0 | 851,521.3 | 24.6 | 0.0 |
| GPC | 98.04 | 3.0 | 14,305.4 | 18.1 | 54.9 |
| GPN | 169.33 | 0.0 | 26,221.6 | 55.0 | 1.3 |
| GPS | 19.55 | 5.0 | 7,332.7 | 7.0 | 35.1 |
| GRMN | 79.35 | 2.8 | 14,542.3 | 21.2 | 58.7 |
| GS | 221.21 | 1.5 | 80,996.8 | 9.2 | 13.5 |
| GT | 13.80 | 4.5 | 3,236.7 | 7.1 | 31.8 |
| GWW | 296.39 | 1.9 | 16,192.3 | 20.1 | 37.4 |
| HAL | 23.12 | 3.1 | 20,321.6 | 15.2 | 47.2 |
| HAS | 122.87 | 2.1 | 15,653.7 | 49.9 | 105.1 |
| HBAN | 14.29 | 3.9 | 14,986.4 | 11.1 | 43.2 |
| HBI | 15.80 | 3.8 | 5,743.8 | 10.4 | 39.3 |
| HCA | 134.75 | 1.1 | 45,458.4 | ||
| HCP | 32.15 | 4.6 | 15,415.0 | 14.1 | 64.6 |
| HD | 217.24 | 2.0 | 239,159.0 | 21.8 | 44.6 |
| HES | 65.76 | 1.6 | 18,813.2 | -106.1 | -171.1 |
| HFC | 50.21 | 2.6 | 8,553.6 | 8.1 | 21.3 |
| HIG | 57.87 | 2.0 | 20,883.8 | 12.3 | 24.5 |
| HII | 233.83 | 1.4 | 9,687.4 | 12.6 | 17.1 |
| HLT | 97.27 | 0.6 | 27,913.9 | 35.4 | 21.8 |
| HOG | 35.45 | 4.2 | 5,599.4 | 13.0 | 55.1 |
| HOLX | 51.42 | 0.0 | 13,804.6 | -1,018.1 | 0.0 |
| HON | 173.22 | 1.8 | 125,129.6 | 18.1 | 33.4 |
| HP | 49.62 | 0.0 | 5,407.1 | -72.6 | 0.0 |
| HPE | 14.56 | 3.1 | 19,565.0 | 67.2 | 207.1 |
| HPQ | 21.44 | 2.8 | 32,445.5 | 8.6 | 23.8 |
| HRB | 27.76 | 3.6 | 5,626.6 | 13.1 | 47.1 |
| HRL | 41.51 | 1.9 | 22,224.0 | 22.2 | 42.4 |
| HRS | 189.13 | 1.4 | 22,341.2 | 24.9 | 34.6 |
| HSIC | 68.21 | 0.0 | 10,268.2 | 20.5 | 0.0 |
| HST | 17.61 | 4.5 | 13,099.0 | 12.8 | 57.8 |
| HSY | 152.50 | 1.9 | 31,910.5 | 25.6 | 48.5 |
| HUM | 297.89 | 0.7 | 38,420.2 | 23.2 | 16.7 |
| IBM | 149.83 | 4.2 | 132,792.5 | 15.4 | 65.1 |
| ICE | 88.07 | 1.1 | 49,546.8 | 25.1 | 28.4 |
| IDXX | 285.70 | 0.0 | 24,602.0 | 63.5 | 0.0 |
| IFF | 145.31 | 0.0 | 15,555.5 | 41.6 | 0.0 |
| ILMN | 302.76 | 0.0 | 44,094.1 | 47.5 | 0.0 |
| INCY | 85.45 | 0.0 | 18,319.5 | 59.7 | 0.0 |
| INFO | 64.92 | 0.0 | 26,160.8 | 57.7 | 0.0 |
| INTC | 51.45 | 2.4 | 229,031.0 | 11.8 | 28.1 |
| INTU | 280.94 | 0.6 | 72,489.5 | 44.2 | 28.5 |
| IP | 44.42 | 4.4 | 17,903.9 | 11.2 | 49.0 |
| IPG | 23.08 | 3.9 | 8,886.8 | 13.7 | 53.0 |
| IPGP | 135.01 | 0.0 | 7,292.4 | 23.7 | 0.0 |
| IQV | 160.50 | 0.0 | 31,447.0 | 128.8 | 0.0 |
| IR | 125.01 | 1.7 | 30,530.6 | ||
| IRM | 29.72 | 8.0 | 8,569.1 | 29.0 | 233.0 |
| ISRG | 528.70 | 0.0 | 61,273.1 | 50.1 | 0.0 |
| IT | 142.33 | 0.0 | 12,462.3 | 58.4 | 0.0 |
| ITW | 155.41 | 2.6 | 50,785.1 | 20.8 | 53.3 |
| IVZ | 19.14 | 6.2 | 9,351.0 | 13.1 | 82.1 |
| JBHT | 102.72 | 1.0 | 10,958.7 | 23.6 | 23.0 |
| JCI | 42.72 | 2.5 | 37,063.3 | 16.6 | 41.9 |
| JEC | 83.64 | 0.8 | 11,507.9 | 38.4 | 29.2 |
| JEF | 21.46 | 2.0 | 6,453.1 | 56.3 | 111.2 |
| JKHY | 140.77 | 1.1 | 10,740.6 | 36.7 | 39.8 |
| JNJ | 131.13 | 2.8 | 348,581.6 | 21.5 | 59.3 |
| JNPR | 27.12 | 2.7 | 9,314.0 | 19.0 | 52.0 |
| JPM | 115.28 | 2.8 | 374,970.5 | 11.7 | 32.5 |
| JWN | 31.23 | 4.8 | 4,746.3 | 10.1 | 48.5 |
| K | 58.56 | 3.8 | 19,939.5 | 17.2 | 65.3 |
| KEY | 18.31 | 3.7 | 18,597.7 | 10.9 | 39.8 |
| KEYS | 90.15 | 0.0 | 17,163.1 | 61.9 | 0.0 |
| KHC | 32.11 | 7.9 | 38,842.9 | -3.8 | -30.0 |
| KIM | 19.32 | 5.8 | 8,176.0 | 24.0 | 138.8 |
| KLAC | 138.06 | 2.1 | 22,626.8 | 16.3 | 35.0 |
| KMB | 137.18 | 2.9 | 47,602.9 | 26.3 | 77.1 |
| KMI | 20.75 | 4.1 | 46,838.0 | 20.8 | 85.4 |
| KMX | 88.23 | 0.0 | 14,538.5 | 17.3 | 0.0 |
| KO | 53.05 | 2.9 | 229,708.3 | 32.3 | 94.9 |
| KR | 21.25 | 0.0 | 17,118.3 | 9.2 | 0.0 |
| KSS | 54.42 | 4.7 | 8,636.0 | 11.3 | 53.0 |
| KSU | 124.03 | 1.2 | 12,547.2 | 22.1 | 25.5 |
| L | 54.05 | 0.5 | 16,363.3 | 23.1 | 10.8 |
| LB | 25.85 | 8.2 | 7,115.8 | 11.2 | 91.1 |
| LEG | 40.10 | 3.8 | 5,295.4 | 18.5 | 70.8 |
| LEN | 47.58 | 0.3 | 15,608.0 | 8.1 | 2.7 |
| LH | 168.65 | 0.0 | 16,806.1 | 19.8 | 0.0 |
| LIN | 194.08 | 1.7 | 106,653.5 | 18.1 | 30.9 |
| LKQ | 26.94 | 0.0 | 8,330.8 | 20.1 | 0.0 |
| LLL | 245.17 | 1.3 | 19,479.0 | 24.6 | 32.6 |
| LLY | 110.55 | 2.2 | 105,519.6 | ||
| LMT | 365.42 | 2.3 | 103,354.8 | 17.7 | 41.5 |
| LNC | 65.85 | 2.1 | 13,389.0 | 9.2 | 19.5 |
| LNT | 49.89 | 2.7 | 11,737.0 | 22.7 | 62.2 |
| LOW | 103.07 | 1.9 | 81,243.2 | 35.2 | 65.2 |
| LRCX | 210.70 | 2.1 | 31,682.6 | 12.3 | 25.7 |
| LUV | 52.15 | 1.3 | 28,538.1 | 12.1 | 15.2 |
| LW | 67.00 | 1.2 | 9,865.5 | 21.0 | 24.3 |
| LYB | 83.26 | 4.7 | 28,291.2 | 7.5 | 35.6 |
| M | 22.72 | 6.7 | 6,958.9 | 6.3 | 42.5 |
| MA | 277.16 | 0.4 | 282,084.8 | 42.5 | 18.9 |
| MAA | 119.21 | 3.2 | 13,590.6 | 58.0 | 183.3 |
| MAC | 33.11 | 8.9 | 5,075.9 | 46.3 | 412.5 |
| MAR | 139.81 | 1.2 | 46,888.2 | 25.7 | 29.9 |
| MAS | 41.24 | 1.2 | 12,029.8 | 16.8 | 19.4 |
| MAT | 14.59 | 0.0 | 4,999.9 | -18.7 | 0.0 |
| MCD | 211.05 | 2.1 | 162,133.5 | ||
| MCHP | 95.87 | 1.5 | 23,087.0 | 63.5 | 95.4 |
| MCK | 140.38 | 1.1 | 26,562.5 | 1,559.7 | 1,652.5 |
| MCO | 213.73 | 0.9 | 38,344.7 | 31.2 | 28.1 |
| MDLZ | 54.14 | 1.9 | 78,950.5 | 26.6 | 50.4 |
| MDT | 103.75 | 1.9 | 139,145.4 | 30.2 | 58.1 |
| MET | 49.82 | 3.4 | 47,528.0 | 9.6 | 32.3 |
| MGM | 30.00 | 1.6 | 16,079.5 | 86.3 | 141.3 |
| MHK | 125.55 | 0.0 | 9,070.7 | 11.9 | 0.0 |
| MKC | 160.62 | 1.4 | 21,383.1 | 30.9 | 41.8 |
| MLM | 251.34 | 0.8 | 15,391.1 | 31.1 | 24.3 |
| MMC | 99.01 | 1.7 | 51,364.5 | 33.9 | 57.3 |
| MMM | 176.70 | 3.2 | 102,186.8 | 20.9 | 66.0 |
| MNST | 65.05 | 0.0 | 35,609.7 | 34.8 | 0.0 |
| MO | 47.79 | 6.6 | 90,602.9 | 14.2 | 93.6 |
| MOS | 25.12 | 0.4 | 9,741.1 | 17.3 | 6.8 |
| MPC | 56.65 | 3.3 | 37,803.6 | 10.7 | 35.7 |
| MRK | 83.95 | 2.6 | 214,390.3 | ||
| MRO | 14.24 | 1.4 | 11,557.2 | 13.0 | 18.4 |
| MS | 44.60 | 2.7 | 74,107.5 | 9.6 | 25.7 |
| MSCI | 228.76 | 0.9 | 19,296.7 | 34.8 | 32.4 |
| MSFT | 139.43 | 1.3 | 1,072,695.1 | 27.3 | 35.8 |
| MSI | 167.45 | 1.3 | 27,354.5 | 27.3 | 35.8 |
| MTB | 164.04 | 2.4 | 22,075.4 | 11.7 | 28.5 |
| MTD | 763.39 | 0.0 | 18,849.5 | 36.0 | 0.0 |
| MU | 45.76 | 0.0 | 52,386.3 | 5.2 | 0.0 |
| MXIM | 61.75 | 2.9 | 17,470.6 | 20.5 | 58.8 |
| MYL | 20.63 | 0.0 | 11,055.1 | 343.8 | 0.0 |
| NBL | 22.36 | 2.0 | 10,568.9 | -11.4 | -22.8 |
| NCLH | 48.94 | 0.0 | 10,446.7 | 11.2 | 0.0 |
| NDAQ | 96.54 | 1.8 | 16,040.2 | 29.5 | 54.6 |
| NEE | 208.62 | 2.3 | 100,319.4 | 29.8 | 67.1 |
| NEM | 36.93 | 1.5 | 30,934.6 | -271.5 | -403.0 |
| NFLX | 329.60 | 0.0 | 142,703.6 | 124.8 | 0.0 |
| NFX | |||||
| NI | 29.81 | 2.7 | 11,036.4 | -77.1 | -204.6 |
| NKE | 86.33 | 1.0 | 136,630.2 | 33.7 | 33.3 |
| NKTR | 28.76 | 0.0 | 5,103.7 | 7.4 | 0.0 |
| NLSN | 23.33 | 6.1 | 8,140.8 | -11.2 | -68.2 |
| NOC | 352.00 | 1.4 | 59,711.7 | 17.1 | 23.9 |
| NOV | 24.46 | 0.9 | 8,883.9 | -1.7 | -1.5 |
| NRG | 34.36 | 0.3 | 9,294.3 | 24.1 | 8.3 |
| NSC | 192.52 | 1.7 | 50,708.5 | 18.5 | 32.0 |
| NTAP | 59.58 | 2.7 | 14,278.9 | 12.9 | 34.6 |
| NTRS | 98.41 | 2.3 | 21,293.5 | 14.8 | 34.4 |
| NUE | 56.03 | 2.8 | 17,052.6 | 7.9 | 22.1 |
| NVDA | 172.47 | 0.4 | 106,849.1 | 31.9 | 11.3 |
| NWL | 14.24 | 6.5 | 5,986.9 | -0.8 | -5.5 |
| NWS | 13.65 | 1.5 | 8,005.0 | -47.8 | -69.9 |
| NWSA | 13.33 | 1.5 | 7,829.5 | -46.7 | -69.8 |
| O | 69.90 | 3.8 | 22,159.0 | 52.2 | 198.1 |
| OKE | 69.74 | 5.0 | 27,741.3 | 23.5 | 116.5 |
| OMC | 80.49 | 3.1 | 17,636.8 | 13.5 | 41.5 |
| ORCL | 56.85 | 1.4 | 191,776.3 | 18.4 | 25.9 |
| ORLY | 383.64 | 0.0 | 29,399.1 | 22.6 | 0.0 |
| OXY | 51.49 | 5.9 | 39,265.9 | 9.7 | 57.4 |
| PAYX | 85.10 | 2.7 | 30,954.1 | 29.5 | 78.9 |
| PBCT | 16.40 | 4.2 | 6,631.7 | 12.5 | 52.8 |
| PCAR | 70.82 | 1.7 | 24,576.9 | 10.7 | 18.1 |
| PEG | 57.96 | 3.2 | 29,259.3 | 20.0 | 63.4 |
| PEP | 129.85 | 2.9 | 182,433.2 | 14.3 | 40.9 |
| PFE | 39.49 | 3.7 | 215,354.7 | 17.7 | 64.9 |
| PFG | 58.95 | 3.6 | 16,557.2 | 10.6 | 37.9 |
| PG | 119.77 | 2.4 | 302,028.0 | 82.0 | 197.4 |
| PGR | 81.46 | 3.2 | 47,142.7 | ||
| PH | 177.41 | 1.7 | 22,680.8 | 16.0 | 27.5 |
| PHM | 31.70 | 1.3 | 8,802.4 | 9.6 | 12.5 |
| PKG | 102.10 | 3.1 | 9,736.7 | 12.2 | 37.4 |
| PKI | 87.13 | 0.3 | 9,708.7 | ||
| PLD | 81.92 | 2.5 | 51,758.9 | 30.2 | 74.5 |
| PM | 85.15 | 5.3 | 134,269.0 | 16.9 | 89.5 |
| PNC | 141.48 | 0.0 | 63,438.2 | ||
| PNR | 38.95 | 1.8 | 6,543.8 | 18.2 | 33.2 |
| PNW | 92.09 | 3.1 | 10,321.6 | 19.6 | 61.2 |
| PPG | 118.87 | 1.6 | 28,109.4 | 23.3 | 37.6 |
| PPL | 29.85 | 5.5 | 21,450.2 | 11.5 | 63.5 |
| PRGO | 54.18 | 1.4 | 7,376.2 | 64.7 | 90.6 |
| PRU | 102.07 | 3.6 | 41,550.0 | 11.7 | 42.4 |
| PSA | 245.97 | 3.3 | 42,426.3 | 29.3 | 96.5 |
| PSX | 103.23 | 3.2 | 46,520.9 | 8.9 | 28.3 |
| PVH | 88.48 | 0.2 | 6,673.3 | 10.4 | 1.7 |
| PWR | 37.89 | 0.2 | 5,403.3 | 15.1 | 3.2 |
| PXD | 138.53 | 0.2 | 23,224.0 | 20.6 | 4.8 |
| PYPL | 111.10 | 0.0 | 131,834.1 | 51.9 | 0.0 |
| QCOM | 75.12 | 3.3 | 90,946.5 | 39.5 | 131.1 |
| QRVO | 74.99 | 0.0 | 8,911.8 | 69.0 | 0.0 |
| RCL | 115.32 | 2.4 | 24,307.0 | 13.0 | 31.5 |
| RE | 249.07 | 2.2 | 10,252.3 | 19.6 | 42.8 |
| REG | 67.00 | 3.4 | 11,208.0 | 39.9 | 134.1 |
| REGN | 311.78 | 0.0 | 34,111.8 | 13.9 | 0.0 |
| RF | 15.97 | 3.5 | 16,114.2 | 11.0 | 38.6 |
| RHI | 61.42 | 1.9 | 7,254.2 | 16.0 | 30.8 |
| RHT | 187.71 | 0.0 | 33,429.8 | 71.9 | 0.0 |
| RJF | 80.98 | 1.6 | 11,424.7 | 11.2 | 18.1 |
| RL | 104.34 | 2.4 | 8,334.6 | 19.0 | 45.5 |
| RMD | 130.46 | 1.1 | 18,672.6 | 46.2 | 52.5 |
| ROK | 162.98 | 2.3 | 19,352.0 | 18.9 | 43.7 |
| ROL | 34.20 | 1.2 | 11,137.8 | 49.5 | 57.8 |
| ROP | 363.28 | 0.5 | 38,093.0 | 33.5 | 16.4 |
| ROST | 106.85 | 0.9 | 38,781.8 | 24.6 | 21.5 |
| RSG | 89.15 | 1.7 | 28,694.4 | 27.4 | 46.0 |
| RTN | 183.93 | 1.9 | 51,812.9 | 16.9 | 32.9 |
| SBAC | 246.75 | 0.0 | 28,134.9 | 214.6 | 0.0 |
| SBUX | 96.10 | 1.5 | 117,062.5 | ||
| SCHW | 42.92 | 1.4 | 57,432.1 | 16.0 | 22.3 |
| SEE | 42.20 | 1.5 | 6,625.2 | 15.7 | 23.6 |
| SHW | 515.98 | 0.8 | 47,513.7 | 40.7 | 31.4 |
| SIVB | 229.76 | 0.0 | 11,902.1 | 10.5 | 0.0 |
| SJM | 112.97 | 3.0 | 12,901.2 | 25.0 | 75.1 |
| SLB | 40.04 | 5.1 | 54,698.0 | 26.5 | 134.1 |
| SLG | 82.02 | 4.1 | 7,133.9 | 29.6 | 121.1 |
| SNA | 155.20 | 2.4 | 8,602.3 | 12.4 | 29.2 |
| SNPS | 135.48 | 0.0 | 20,291.8 | 33.4 | 0.0 |
| SO | 55.86 | 4.3 | 57,547.5 | 17.1 | 74.2 |
| SPG | 161.59 | 5.0 | 106,502.8 | 22.6 | 112.9 |
| SPGI | 244.36 | 0.9 | 59,534.4 | 32.5 | 27.8 |
| SRE | 136.39 | 2.7 | 37,449.1 | 37.4 | 100.1 |
| STI | 66.12 | 3.0 | 29,356.8 | 11.5 | 34.9 |
| STT | 59.07 | 3.2 | 21,937.5 | 10.6 | 33.9 |
| STX | 46.85 | 5.3 | 13,133.4 | 9.0 | 47.6 |
| STZ | 198.33 | 1.5 | 38,496.8 | 15.2 | 22.5 |
| SWK | 149.58 | 0.0 | 22,975.4 | 31.3 | 0.0 |
| SWKS | 87.04 | 1.7 | 15,153.9 | 14.5 | 24.0 |
| SYF | 36.15 | 2.3 | 24,009.9 | 7.5 | 17.4 |
| SYK | 212.78 | 1.0 | 79,699.0 | 22.4 | 21.3 |
| SYMC | 21.87 | 1.4 | 13,542.4 | 469.3 | 642.0 |
| SYY | 69.14 | 2.2 | 35,788.1 | 22.5 | 48.5 |
| T | 34.31 | 5.9 | 249,684.9 | 14.4 | 85.5 |
| TAP | 52.07 | 2.9 | 12,314.6 | 11.4 | 32.7 |
| TDG | 487.70 | 0.0 | 25,873.1 | 33.2 | 0.0 |
| TEL | 92.88 | 1.9 | 31,359.5 | 9.9 | 18.9 |
| TFX | 345.69 | 0.4 | 16,019.1 | 85.7 | 33.6 |
| TGT | 87.25 | 2.9 | 44,511.6 | 15.1 | 44.6 |
| TIF | 94.80 | 2.3 | 11,426.8 | 20.3 | 47.6 |
| TJX | 55.26 | 1.5 | 66,672.6 | 22.2 | 33.0 |
| TMK | 92.00 | 0.7 | 10,083.8 | 14.3 | 10.3 |
| TMO | 282.51 | 0.3 | 113,558.6 | 32.0 | 8.1 |
| TPR | 30.59 | 4.4 | 8,895.6 | 12.5 | 55.1 |
| TRIP | 44.31 | 0.0 | 6,145.1 | 45.6 | 0.0 |
| TROW | 115.24 | 2.5 | 27,174.8 | 14.3 | 36.2 |
| TRV | 147.12 | 2.1 | 38,438.2 | 14.6 | 30.9 |
| TSCO | 110.20 | 1.2 | 13,180.1 | 24.3 | 28.5 |
| TSN | 79.95 | 1.8 | 23,976.4 | 13.9 | 24.4 |
| TSS | 136.71 | 0.4 | 23,881.0 | 41.5 | 16.0 |
| TTWO | 124.19 | 0.0 | 13,943.5 | 42.2 | 0.0 |
| TWTR | 42.73 | 0.0 | 31,513.9 | 13.9 | 0.0 |
| TXN | 127.27 | 2.3 | 120,129.0 | 22.8 | 52.0 |
| TXT | 49.93 | 0.2 | 11,584.4 | 10.0 | 1.6 |
| UA | 20.40 | 0.0 | 9,493.8 | ||
| UAA | 23.14 | 0.0 | 10,860.4 | 122.2 | 0.0 |
| UAL | 93.02 | 0.0 | 24,132.6 | 9.4 | 0.0 |
| UDR | 46.71 | 2.9 | 21,703.4 | 81.4 | 232.3 |
| UHS | 151.06 | 0.3 | 13,779.8 | 17.2 | 4.5 |
| ULTA | 353.98 | 0.0 | 20,380.2 | 30.5 | 0.0 |
| UNH | 255.51 | 1.5 | 242,270.9 | ||
| UNM | 32.61 | 3.2 | 6,949.7 | 13.1 | 41.5 |
| UNP | 179.51 | 1.9 | 126,322.2 | 21.2 | 39.8 |
| UPS | 120.29 | 3.1 | 102,916.8 | 21.9 | 68.4 |
| URI | 128.90 | 0.0 | 10,027.3 | 9.5 | 0.0 |
| USB | 57.18 | 2.6 | 90,509.8 | 13.4 | 34.8 |
| UTX | 135.59 | 2.1 | 116,741.0 | 21.9 | 47.0 |
| V | 181.59 | 0.5 | 315,675.2 | 34.8 | 18.4 |
| VAR | 118.46 | 0.0 | 10,813.5 | 32.0 | 0.0 |
| VFC | 86.94 | 2.3 | 35,013.4 | 30.0 | 67.7 |
| VIAB | 30.43 | 2.6 | 12,479.2 | 7.6 | 19.6 |
| VLO | 85.14 | 4.0 | 35,377.9 | 14.0 | 56.1 |
| VMC | 141.52 | 0.8 | 18,562.5 | 33.2 | 27.9 |
| VNO | 64.32 | 4.0 | 12,309.3 | 4.3 | 17.1 |
| VRSK | 152.58 | 0.3 | 24,883.8 | 41.9 | 13.8 |
| VRSN | 214.71 | 0.0 | 25,323.3 | 41.0 | 0.0 |
| VRTX | 169.60 | 0.0 | 43,422.8 | 20.0 | 0.0 |
| VTR | 68.10 | 4.7 | 25,224.0 | 48.8 | 228.3 |
| VZ | 56.04 | 4.2 | 234,205.3 | 14.5 | 61.2 |
| WAT | 216.61 | 0.0 | 14,820.4 | 27.3 | 0.0 |
| WBA | 55.13 | 3.2 | 50,034.1 | 10.8 | 34.3 |
| WCG | 291.13 | 0.0 | 14,700.2 | 27.7 | 0.0 |
| WDC | 55.43 | 3.5 | 16,580.8 | 90.7 | 320.6 |
| WEC | 86.78 | 2.6 | 27,335.9 | 25.2 | 65.2 |
| WELL | 84.25 | 4.1 | 33,994.8 | 89.6 | 371.5 |
| WFC | 48.36 | 3.6 | 214,571.6 | 9.9 | 35.9 |
| WHR | 149.02 | 3.1 | 9,576.7 | 10.4 | 32.1 |
| WLTW | 198.06 | 1.2 | 25,522.8 | 33.6 | 41.7 |
| WM | 117.90 | 1.7 | 50,063.6 | 28.5 | 47.2 |
| WMB | 24.89 | 5.6 | 30,318.5 | -1,250.8 | -6,998.6 |
| WMT | 111.56 | 1.9 | 319,899.9 | 38.4 | 71.6 |
| WRK | 36.66 | 4.8 | 9,549.1 | 11.0 | 52.5 |
| WU | 20.98 | 3.7 | 9,001.8 | 11.5 | 42.4 |
| WY | 25.80 | 5.2 | 19,435.2 | 5,608.7 | 29,236.6 |
| WYNN | 131.16 | 2.2 | 14,600.0 | 15.8 | 35.0 |
| XEC | 51.62 | 1.4 | 5,179.2 | 7.8 | 11.0 |
| XEL | 60.29 | 2.5 | 31,184.0 | 24.0 | 61.2 |
| XLNX | 116.16 | 1.2 | 30,188.8 | 31.3 | 37.9 |
| XOM | 75.34 | 4.4 | 318,812.6 | 17.4 | 75.6 |
| XRAY | 54.71 | 0.6 | 13,259.5 | -11.7 | -7.3 |
| XRX | 32.16 | 3.1 | 7,363.3 | 14.2 | 43.3 |
| XYL | 81.04 | 1.1 | 14,596.2 | 26.5 | 28.4 |
| YUM | 113.27 | 1.3 | 34,648.6 | 26.1 | 34.6 |
| ZBH | 134.81 | 0.7 | 27,989.7 | -76.6 | -53.8 |
| ZION | 44.63 | 2.6 | 8,047.0 | 10.2 | 26.8 |
| ZTS | 115.70 | 0.5 | 55,423.6 | 40.2 | 20.1 |
| Ticker | Price | Dividend Yield | Market Cap ($M) | P/E Ratio | Payout Ratio |
Table of Contents
While we advise reading this article in its entirety, you can skip to any particular section using the table of contents below:
- How To Use The S&P 500 Stocks List To Find Investment Ideas
- Video: Why the S&P 500 is the Best Benchmark for Large Cap U.S. Equities
- Index Methodology
- S&P 500 Components by Weight
- The Historical Performance of the S&P 500
- Index Composition & Characteristics
- How To Use The S&P 500 As A Benchmark
How To Use The S&P 500 Stocks List To Find Investment Ideas
Having an Excel document containing the financial metrics of every stock within the S&P 500 is very powerful.
This document becomes even more useful when combined with a working knowledge of Microsoft Excel.
With that in mind, this section will provide a tutorial of how to implement a useful screen for finding reasonably priced S&P 500 securities with above-average dividend yields. We will specifically screen for S&P 500 securities with:
- Price-to-earnings ratios of 15 or lower
- Dividend yields of 3.0% or higher
For reference, the dividend yield of the S&P 500 is currently below 2%. This screen will find value securities with solid dividend yields. The steps below provide a quick walkthrough of how to implement this screen using the Excel Spreadsheet download at the beginning of this article.
Step 1: Download the S&P 500 Stocks List near the beginning of this article.
Step 2: Filter the columns.
Step 3: Filter for stocks with yields of 3%+ and P/E ratios of 15 or less.
The tutorial below walks through steps 2 and 3 for reference.
The remaining stocks in this spreadsheet are S&P 500 stocks with price-to-earnings ratios below 15 and dividend yields above 3%. You now have a solid fundamental understanding of how to use the S&P 500 Stocks List to find compelling investment ideas.
If you are looking for other investment ideas from the S&P 500 components, take a look at the following articles:
- The Top 10 Highest Yielding S&P 500 Stocks
- The 100 Highest Beta Stocks In The S&P 500
- The 100 Lowest Beta Stocks In The S&P 500
- The Highest Sharpe Ratio Stocks Within The S&P 500
The remainder of this article will explain how to use the S&P 500 Index as a benchmark for investment performance before directing you to other useful investing resources.
Video: Why the S&P 500 is the Best Benchmark for Large Cap U.S. Equities
In the following video, we discuss why the S&P 500 is our favorite benchmark for large cap U.S. equities.
Index Methodology
The S&P 500 is most well-known for containing the 500 largest companies in the United States when measured by market capitalization.
The Index also has other criteria, including:
- Universe: All constituents must be U.S. companies.
- Eligibility Market Cap: Companies with a market capitalization of US$6.1 billion or greater.
- Public Float: At least 50% of shares outstanding must be available for trading.
- Financial Viability: Companies must have positive as-reported earnings over the most recent quarter, as well as over the most recent four quarters (summed together).
- Adequate Liquidity and Reasonable Price: Consists of highly tradable common stocks, with active and deep markets.
S&P 500 Companies by Weight
The S&P 500 constituent companies are listed below, along with their component weights in the Index. Data is as of June 5th, 2019:
June 2019 S&P 500 Weightings
| 1 | MSFT | Microsoft Corp | 3.7% |
| 2 | AMZN | Amazon.com Inc | 3.3% |
| 3 | AAPL | Apple Inc | 3.3% |
| 4 | GOOGL | Alphabet Inc | 2.8% |
| 5 | GOOG | Alphabet Inc | 2.8% |
| 6 | BRK.B | Berkshire Hathaway Inc | 1.9% |
| 7 | FB | Facebook Inc | 1.9% |
| 8 | V | Visa Inc | 1.4% |
| 9 | JNJ | Johnson & Johnson | 1.4% |
| 10 | JPM | JPMorgan Chase & Co | 1.4% |
| Symbol | Name | S&P 500 Weight |
Return to the Table of Contents
The Historical Performance of the S&P 500
The S&P 500’s historical performance over the long-term is often cited as anywhere between 7% and 10% on an annualized basis. The S&P 500 has generated total inflation-adjusted returns (including reinvested dividends) of 6.9% from January of 1871 through June 2019.
Source: DQYDJ
And, the S&P 500’s Sharpe ratio has averaged around 0.33 over the long run. You can see the Sharpe ratios of individual S&P 500 components here.
Interestingly, the 4 worst total return days for The S&P 500 since 1990 all occurred in 2008:
- October 15th, 2008 | 9.0% decline
- December 1st, 2008 | 8.9% decline
- September 29th, 2008 | 8.8% decline
- October 9th, 2008 | 7.6% decline
The 4 best total return days for The S&P 500 since 1990 are shown below as well for balance:
- October 13th, 2008 | 11.6% increase
- October 28th, 2008 | 10.8% increase
- March 23rd, 2009 | 7.1% increase
- November 13th, 2008 | 6.9% increase
The data above shows just how volatile the market was during the last half of 2008 and the first quarter of 2009. The Great Recession was an especially chaotic market period.
The S&P 500 generated mediocre performance in July 2019. During the month, the S&P 500 ETF (SPY) generated total returns of 0.6%. This performance comes after a phenomenal June. In June, the S&P 500 ETF had total returns of 7.0%. July’s small growth builds on June’s excellent performance.
For 2019 through July, the S&P 500 ETF has generated total returns of 20.1%. This is already well ahead of average annual returns for the S&P 500, and we are only 7/12 of the way through the year. We will update this article monthly to continue tracking the S&P 500’s performance.
Index Composition & Characteristics
Understanding the characteristics of the S&P 500 is useful because it allows investors to know the traits of the “average” large capitalization company in the United States. According to the index provider (Standard & Poor’s), the S&P 500 currently has the following characteristics:
- Number of constituents: 505
- Mean total market cap: $51.5 billion
- Largest total market cap: $1,057.9 billion [Microsoft (MSFT)]
- Smallest total market cap: $2.7 billion
- Median total market cap: $22.5 billion
- Weight of top 10 constituents: 21.8%
The top 10 S&P 500 Index constituents by index weight are shown below.
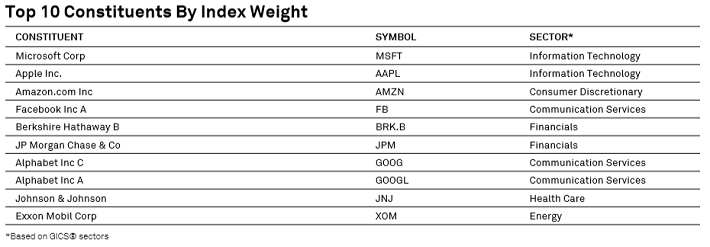
Source: Standard & Poor’s
A sector breakdown of the S&P 500 Index is shown below.
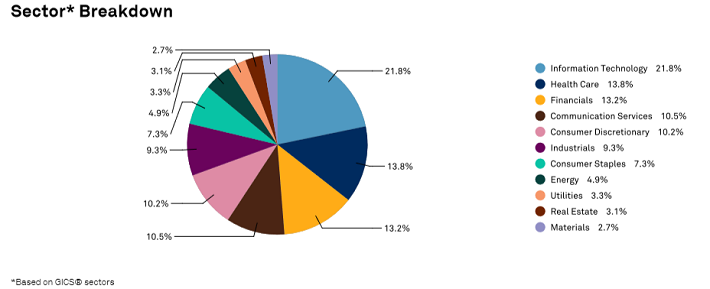
Source: Standard & Poor’s
How To Use The S&P 500 As A Benchmark
Investors can gain passive access to a broad basket of S&P 500 stocks by investing in index ETFs that track the benchmark. Accordingly, it is useful to ensure that your portfolio’s performance is comparable to the S&P 500, especially on a risk-adjusted basis.
The easiest way to measure the performance of the S&P 500 Index is by using a free financial tool like Google Finance or Yahoo! Finance. Download historical data of S&P 500 Index levels from these resources, and compare its performance to the performance of your portfolio. If it turns out that the index is trouncing your performance over long periods of time, then changing to a passive investment strategy might be a wise decision.
Final Thoughts
The S&P 500 Stocks List is an excellent place to look for investment ideas. With that said, it is not the only resource that investors can use to find high quality dividend growth stocks.
If you’re looking for dividend stocks with long histories of steadily increasing dividend payments, the following databases contain some of the most high-quality dividend stocks around:
- The Dividend Aristocrats: dividend stocks with 25+ years of consecutive dividend increases
- The Dividend Achievers: dividend stocks with 10+ years of consecutive dividend increases
- The Dividend Kings: considered the “best-of-the-best” when it comes to dividend growth, the exclusive Dividend Kings list contains stocks that have 50+ years of consecutive dividend increases
- The Blue Chip Stocks List: The combination of our Kings, Achievers, and Aristocrats lists
- High Dividend Stocks List: 300+ securities with 5%+ Yields
You can also find investment opportunities by looking at our other lists, which include:
- The Complete List Of All REITs
- The Complete List Of All MLPs
- Russell 2000 Stocks
- Dow 30 Stocks
- Monthly Dividend Stocks
- High Dividend Stocks: 300+ securities with 5%+ yields