


Article updated August 2nd, 2019 by Ben Reynolds
Spreadsheet data updated weekly on Wednesdays
Monthly dividend stocks are securities that pay a dividend every month instead of quarterly or annually.
More frequent dividend payments mean a smoother income stream for investors.
This article includes:
- A free spreadsheet on all 45 monthly dividend stocks
- Links to detailed stand-alone analysis on all 45 monthly dividend stocks
- Several other resources to help you invest in monthly dividend securities for steady income
The downloadable Monthly Dividend Stocks Spreadsheet above contains the following for each stock that pays monthly dividends:
- Dividend yield
- Name and ticker
- Market cap
- Payout ratio
- Beta
Table of Contents
- How to Use the Monthly Dividend Stocks Spreadsheet to Find Dividend Investment Ideas
- Detailed Analysis on All of The Monthly Dividend Stocks
- Performance Through June 2019
- Why Monthly Dividends Matter
- The Dangers of Investing in Monthly Dividend Stocks
- Final Thoughts
You can learn more about 5 of our favorite monthly dividend stocks in the following video.
You can also view financial data on all the stocks in our monthly dividend database below:
| AD.TO | Alaris Royalty Corp. | 20.62 | 8.0 | 749.9 | 10.9 | 86.8 |
| AGNC | AGNC Investment Corp. | 17.37 | 12.3 | 9,476.9 | -11.3 | -138.2 |
| APLE | Apple Hospitality REIT, Inc. | 15.74 | 7.6 | 3,539.3 | 17.9 | 135.7 |
| ARR | ARMOUR Residential REIT, Inc. | 18.09 | 12.6 | 1,067.8 | -1.9 | -24.3 |
| CHP.UN.TO | Choice Properties Real Estate Investment Trust | 13.76 | 5.3 | 4,239.0 | -13.4 | -71.1 |
| CHR.TO | Chorus Aviation Inc. | 7.91 | 6.1 | 1,241.0 | 12.0 | 72.6 |
| CLDT | Chatham Lodging Trust | 18.49 | 7.0 | 877.4 | 29.5 | 206.5 |
| CPTA | Capitala Finance Corp. | 9.54 | 10.5 | 153.4 | -9.4 | -98.3 |
| CRT | Cross Timbers Royalty Trust | 10.98 | 11.6 | 65.7 | 8.7 | 100.3 |
| D.UN.TO | Dream Office Real Estate Investment Trust | 24.25 | 4.1 | 1,468.0 | 10.6 | 43.6 |
| DIR.UN.TO | Dream Industrial Real Estate Investment Trust | 12.16 | 5.8 | 1,449.0 | 12.4 | 71.5 |
| DRG.UN.TO | Dream Global Real Estate Investment Trust | 14.07 | 5.6 | 2,726.0 | 3.8 | 21.4 |
| DX | Dynex Capital, Inc. | 16.44 | 12.7 | 417.3 | -3.6 | -45.8 |
| ECC | Eagle Point Credit Co., Inc. | 17.30 | 13.9 | 420.4 | -23.9 | -332.1 |
| EIF.TO | Exchange Income Corporation | 37.84 | 5.8 | 1,208.0 | 17.7 | 102.4 |
| EPR | EPR Properties | 75.00 | 5.8 | 5,638.0 | 20.1 | 117.2 |
| ERF | Enerplus Corp. | 6.77 | 1.4 | 1,552.2 | 5.8 | 8.2 |
| GAIN | Gladstone Investment Corp. | 11.37 | 7.2 | 370.2 | 4.6 | 32.8 |
| GLAD | Gladstone Capital Corp. | 9.52 | 8.8 | 279.1 | 31.9 | 282.1 |
| GOOD | Gladstone Commercial Corp. | 21.52 | 7.0 | 665.5 | 342.1 | 2,402.0 |
| GRP.U | Granite Real Estate Investment Trust | 46.79 | 4.5 | 2,316.0 | 4.6 | 21.1 |
| HCAP | Harvest Capital Credit Corp. | 10.19 | 10.9 | 62.9 | 21.2 | 231.0 |
| HRZN | Horizon Technology Finance Corp. | 12.15 | 9.9 | 164.6 | 9.8 | 96.4 |
| IPL.TO | Inter Pipeline Ltd. | 22.22 | 7.7 | 9,078.0 | 16.0 | 122.6 |
| LAND | Gladstone Land Corp. | 11.60 | 4.6 | 213.2 | ||
| LTC | LTC Properties, Inc. | 46.62 | 4.9 | 1,859.8 | 11.9 | 58.1 |
| MAIN | Main Street Capital Corp. | 42.40 | 5.5 | 2,671.3 | 14.7 | 80.7 |
| O | Realty Income Corp. | 69.90 | 3.8 | 22,159.0 | 52.2 | 198.1 |
| ORC | Orchid Island Capital, Inc. | 6.29 | 14.2 | 382.3 | -22.1 | -314.6 |
| OXLC | Oxford Lane Capital Corp. | 10.73 | 15.1 | 455.3 | -32.0 | -484.2 |
| PBA | Pembina Pipeline Corp. | 36.49 | 4.8 | 18,513.0 | 21.4 | 101.9 |
| PFLT | PennantPark Floating Rate Capital Ltd. | 11.77 | 9.7 | 457.1 | 29.3 | 283.1 |
| PRT | PermRock Royalty Trust | 7.98 | 18.3 | 96.7 | 5.5 | 100.3 |
| PSEC | Prospect Capital Corp. | 6.66 | 10.8 | 2,451.3 | 11.1 | 119.9 |
| RNW.TO | TransAlta Renewables Inc. | 13.76 | 6.8 | 3,622.0 | 14.6 | 99.5 |
| ROYT | Pacific Coast Oil Trust | 2.18 | 13.0 | 84.9 | 7.5 | 98.1 |
| SBR | Sabine Royalty Trust | 46.58 | 7.7 | 676.2 | 12.8 | 98.4 |
| SCM | Stellus Capital Investment Corp. | 14.46 | 9.3 | 233.1 | 8.0 | 74.5 |
| SJR | Shaw Communications, Inc. | 19.55 | 4.6 | 10,121.5 | 17.3 | 78.8 |
| SJT | San Juan Basin Royalty Trust | 3.39 | 12.2 | 145.4 | 8.9 | 108.7 |
| SPB.TO | Superior Plus Corp. | 13.19 | 5.5 | 2,319.0 | 27.5 | 150.0 |
| STAG | STAG Industrial, Inc. | 30.16 | 4.7 | 3,811.0 | 49.4 | 231.7 |
| SUNS | Solar Senior Capital Ltd. | 16.80 | 8.4 | 270.2 | 17.2 | 143.9 |
| VET | Vermilion Energy, Inc. | 18.10 | 12.0 | 2,661.3 | 10.4 | 125.4 |
| WSR | Whitestone REIT | 12.89 | 8.8 | 513.4 | 31.0 | 274.2 |
| Ticker | Name | Price | Dividend Yield | Market Cap ($M) | P/E Ratio | Payout Ratio |
Having the list of monthly dividend stocks along with metrics that matter is a great way to begin creating a monthly passive income stream.
High yielding monthly dividend payers have a unique mix of characteristics that make them especially suitable for investors seeking current income.
Keep reading this article to learn more about investing in monthly dividend stocks.
How to Use the Monthly Dividend Stocks Sheet to Find Dividend Investment Ideas
For investors that use their dividend stock portfolios to generate passive monthly income, one of the main concerns is the sustainability of the company’s dividend.
A dividend cut indicates one of two things:
- The business isn’t performing well enough to sustain a dividend
- Management is no longer interested in rewarding shareholders with dividends
Either of these should be considered an automatic sign to sell a dividend stock.
Of the two reasons listed above, #1 is more likely to happen. Thus, it is very important to continually measure the financial feasibility of a company’s dividend.
This is best measured by using the payout ratio. The payout ratio is a mathematical expression that shows what percentage of a company’s earnings is distributed to shareholders as dividend payments. A very high payout ratio could indicate that a company’s dividend is in danger of being reduced or eliminated completely.
For readers unfamiliar with Microsoft Excel, this section will show you how to list the stocks in the spreadsheet in order of decreasing payout ratio.
Step 1: Download the monthly dividend stocks excel sheet at the link above.
Step 2: Highlight columns A through H, and go to “Data”, then “Filter”.
Step 3: Click on the ‘filter’ icon at the top of the payout ratio column.
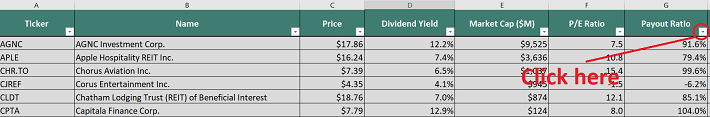
Step 4: Filter the high dividend stocks spreadsheet in descending order by payout ratio. This will list the stocks with lower (safer) payout ratios at the top.
Detailed Analysis On All of The Monthly Dividend Stocks
You can see detailed analysis on every monthly dividend security we’ve found by clicking the links below. We’ve included our most recent Sure Analysis Research Database report update in brackets as well, where applicable.
- AGNC Investment (AGNC) | [4/2/19]
- Alaris Royalty (ALARF)| [6/14/19]
- Apple Hospitality REIT (APLE) | [5/28/19]
- ARMOUR Residential REIT (ARR) | [5/6/19]
- Capitala Finance Corporation (CPTA) | [7/21/19]
- Chatham Lodging (CLDT) | [5/27/19]
- Choice Properties REIT (PPRQF) | [7/18/19]
- Chorus Aviation (CHR.TO)
- Cross Timbers Royalty Trust (CRT)
- Dream Global REIT (DRG.UN.TO) | [6/26/19]
- Dream Industrial REIT (DIR.UN.TO) | [7/4/19]
- Dream Office REIT (D.UN.TO) | [7/4/19]
- Dynex Capital (DX) | [6/25/19]
- Eagle Point Credit (ECC) | [6/25/19]
- Enerplus (ERF) | [7/7/19]
- EPR Properties (EPR) | [5/20/19]
- Exchange Income Corporation (EIFZF)
- Gladstone Capital Corporation (GLAD) | [7/13/19]
- Gladstone Commercial Corporation (GOOD) | [7/15/19]
- Gladstone Investment Corporation (GAIN) | [5/15/19]
- Gladstone Land Corporation (LAND)
- Granite Real Estate Investment Trust (GRP) | [7/10/19]
- Harvest Capital Credit Corporation (HCAP)
- Horizon Technology Finance (HRZN)
- Inter Pipeline (IPL.TO) | [6/3/19]
- LTC Properties (LTC) | [6/10/19]
- Main Street Capital (MAIN) | [5/30/19]
- Orchid Island Capital (ORC) | [5/23/19]
- Oxford Lane Capital (OXLC) | [6/10/19]
- Pacific Coast Oil Trust (ROYT) | [6/6/19]
- Pembina Pipeline (PBA) | [5/28/19]
- Pennant Park Floating Rate (PFLT)
- PermRock Royalty Trust (PRT)
- Prospect Capital Corporation (PSEC) | [5/28/19]
- Realty Income (O) | [5/31/19]
- Sabine Royalty Trust (SBR)
- San Juan Basin Royalty Trust (SJT) – [San Juan recently suspended their dividend]
- Shaw Communications (SJR) | [7/6/19]
- Solar Senior Capital (SUNS)
- Stag Industrial (STAG) | [5/14/19]
- Stellus Capital Investment Corporation (SCM) | [7/22/19]
- Superior Plus (SPB.TO)
- Transalta Renewables (RNW.TO) | [7/17/19]
- Vermilion Energy (VET) | [5/30/19]
- Whitestone REIT (WSR) | [7/2/19]
Note that all of these businesses are either small- or mid-cap companies. You will not see any S&P 500 stocks in this list – it is instead populated by members of the Russell 2000 Index or various international stock market indices. Based on the list above, the bulk of monthly dividend paying securities are REITs and BDCs.
Note: You can see our list of all publicly traded REITs here.
Performance Through July2019
In July 2019, a basket of the 44 monthly dividend stocks above (excluding SJT) generated total returns of 0.2%. For comparison, the Russell 2000 ETF (IWM) generated total returns of 0.3% over the same time period.
Notes: Data for performance is from Ycharts. Canadian company performance may be in the company’s home currency. Year-to-date performance does have survivorship bias as some securities (SJT, GNL) have been excluded as they either eliminate (SJT) or change (GNL) their dividend to quarterly payments.
Monthly dividend stocks just barely underperformed in July of 2019. The market in general was virtually flat, as were monthly dividend stocks.
For fiscal 2019 through July, the basket of 44 monthly dividend stocks has generated total returns of 17.5% versus 17.6% for The Russell 2000 ETF. In the short time period above monthly dividend stocks have generated performance nearly in line with the Russell 2000. We will update our performance section monthly to track future monthly dividend stock returns.
Year-to-date, the best 3 performing monthly dividend stocks (including dividends) are:
- Chorus Aviation, up 41.9%
- Superior Plus, up 39.4%
- Capitala Finance Corporation, up 39.2%
The 3 worst performing monthly dividend stocks (including dividends) year-to-date are:
- Enerplus, down 16.2%
- Vermilion Energy, down 13.1%
- ARMOUR Residential REIT, down 8.2%
Why Monthly Dividends Matter
Monthly dividend payments are beneficial for one group of investors in particular – retirees who rely on dividend stocks for income.
With that said, monthly dividend stocks are better under all circumstances (everything else being equal), because they allow for returns to be compounded on a more frequent basis. More frequent compounding results in better total returns, particularly over long periods of time.
Consider the following performance comparison:
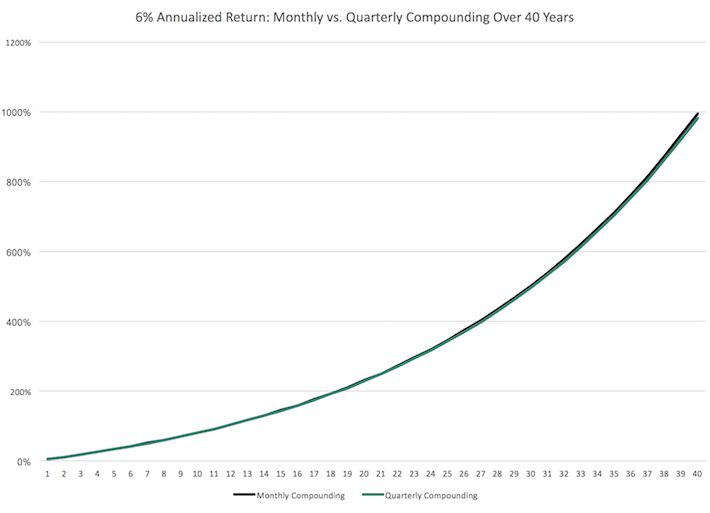
Over the long run, monthly compounding generates slightly higher returns over quarterly compounding. Every little bit helps.
With that said, it might not be practical to manually re-invest dividend payments on a monthly basis. It is more feasible to combine monthly dividend stocks with a dividend reinvestment plan to dollar cost average into your favorite dividend stocks.
The last benefit of monthly dividend stocks is that they allow investors to have – on average – more cash on hand to make opportunistic purchases. Having cash isn’t often important, but when it is, it is really, really important.
Case-in-point: investors who bought a broad basket of stocks at the bottom of the 2008-2009 financial crisis are likely sitting on triple-digit total returns from those purchases today.
The Dangers of Investing In Monthly Dividend Stocks
Monthly dividend stocks have characteristics that make them appealing to do-it-yourself investors looking for a steady stream of income. Typically, these are retirees and people planning for retirement.
Investors should note many monthly dividend stocks are highly speculative. On average, monthly dividend stocks tend to have elevated payout ratios. An elevated payout ratio means there’s less margin for error to continue paying the dividend if business results suffer a temporary (or permanent) decline.
Because of this, we have real concerns that many monthly dividend payers will not be able to continue paying rising dividends in the event of a recession.
Additionally, a high payout ratio means that a company is retaining little money to invest for future growth. This can lead management teams to aggressively leverage their balance sheet, fueling growth with debt. High debt and a high payout ratio is perhaps the most dangerous combination around for a potential future dividend reduction.
With that said, there are a handful of high quality monthly dividend payers around. Chief among them is Realty Income (O). Realty Income has paid increasing dividends (on an annual basis) every year since 1994.
The Realty Income example shows that there are high quality monthly dividend payers around, but they are the exception rather than the norm. We suggest investors do ample due diligence before buying into any monthly dividend payer.
Final Thoughts
Financial freedom is achieved when your passive investment income exceeds your expenses. But the sequence and timing of your passive income investment’s payments can matter.
Monthly payments make matching portfolio income with expenses easier. Most expenses recur monthly whereas most dividend stocks pay quarterly. Investing in monthly dividend stocks matches the frequency of portfolio income payments with the normal frequency of personal expenses.
Additionally, many monthly dividend payers offer investors high yields. The combination of a monthly dividend payment and a high yield should be especially appealing to income investors.
Related: The Best High Dividend Stocks Now
But not all monthly dividend payers offer the safety that income investors need. A monthly dividend is better than a quarterly dividend, but not if that monthly dividend is reduced soon after you invest. The high payout ratios and shorter histories of most monthly dividend securities means they tend to have elevated risk levels.
Because of this, we advise investors to look for high quality monthly dividend payers with reasonable payout ratios, trading at fair or better prices.