


Originally By Dirk S. Leach
Updated by Ben Reynolds on August 19th, 2021
Dollar cost averaging has been around for a long time. I remember my introduction to this investing strategy more than 30 years ago, and it was well entrenched then.
Many people have used dollar cost averaging and had not even recognized they had employed the strategy in their monthly 401K contributions.
Dollar cost averaging is a strategy where the investor places a fixed dollar amount into an investment vehicle (stocks, bonds, mutual funds, etc.) on a regular recurring schedule.
The advantage of dollar cost averaging is that the investor has a disciplined method to follow for making investments and, because of the fixed dollar amount invested, the investor will buy more shares when the market is lower and fewer shares when the market is higher.
However, we should ask, are there better strategies than dollar cost averaging for investing over time and building wealth?
I believe there are.
This article presents two alternate strategies for investing over time and also looks at the performance of a simple lump sum investment.
We will look at performance comparisons under various market scenarios and find out what strategy works best under each market scenario.
Lump Sum Versus Dollar Cost Averaging
Comparing a lump sum investment strategy versus dollar cost averaging is fairly straight forward. Obviously, this comparison is moot if the investor does not have a sizable sum to invest at the outset. However, assuming the investor starts with a significant sum to invest, he/she is faced with deciding how to best deploy that sum.
Should the investor place the entire sum to work all at once or spread out over time?
The table below compares a hypothetical investment of $12,000 either as a lump sum at the beginning of the period or in increments of $200 per month over a 5-year period.
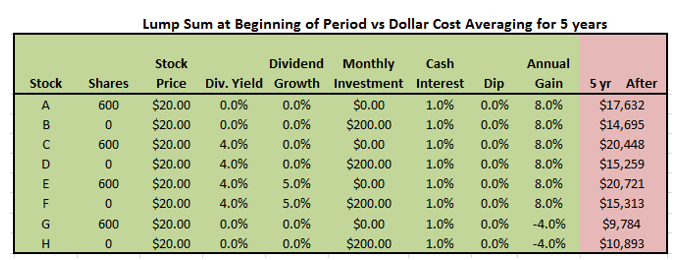
The first two rows, stocks A and B, compare a hypothetical non-dividend paying stock bought at the beginning of the 5 year period (Stock A) versus bought in $200 monthly installments (Stock B) over a 5 year period in a rising bull market.
As you would expect, the total value at the end of the period definitely favors the lump sum investment. This is because the lump sum investment is gaining 8% per year for a full 5 years.
The next 4 lines, stocks C through F, show the same comparison with a 4% dividend included for stocks C and D and with a dividend that grows by 5% per year for stocks E and F. As expected, the results are even more favorable for making a lump sum investment at the beginning of the period.
What happens if the market and the investors stocks make a sustained down turn?
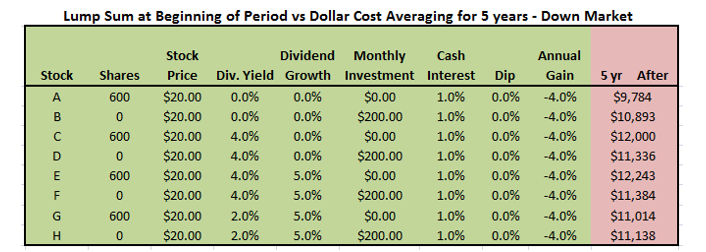
The last two lines, stocks G and H in the chart, clearly show that the investor fairs better with dollar cost averaging in a market experiencing a sustained downtrend.
This is where the dollar cost averaging strategy was intended to shine, a down market allowing the investor to purchase more shares at the lower price. However, the astute reader will ask, but what about dividends? Will dividends have an impact on which strategy the investor should use?
The following chart compares what happens in a sustained down market with dividend paying stocks for a lump sum investment versus dollar cost averaging.
I found the results very interesting. For stocks that pay a significant dividend, or have significant annual dividend growth, investing a lump sum at the beginning of the period wins out even in a sustained down market.
For this hypothetical case, a stock offering a 2% dividend with 5% annual dividend growth is roughly the break-even between investing a lump sum versus dollar cost averaging.
Because of the formulas used in the spreadsheet, I cannot model a flat market where the annual gain is zero. But, by deduction, it is easy to see that in a sustained flat market, a lump sum investment in a non-dividend paying stock versus using dollar cost averaging in the same security will result in essentially the same return at the end of the period.
However, for investments in dividend paying stocks during a flat market, the lump sum strategy will result in a higher return for the investor since more dividends will have been collected by the end of the period.
So, now we have a much better idea of which traditional strategy works best in up, down or flat markets for non-dividend and dividend paying stocks.
But, we still have a major weakness in our overall investment strategy. Most of the time, we don’t know how the market will behave in the future; if we did, we would all be wealthy.
Is there a strategy that investors can use to improve performance in uncertain (typical) markets?
Value Averaging Versus Dollar Cost Averaging
The strategy of Value Averaging has not been around nearly as long as dollar cost averaging.
Value averaging is a strategy where the investor sets a fixed growth rate for the portfolio and adjusts the periodic additions to the portfolio to keep the growth of the portfolio constant.
If the portfolio falls in value from one period to the next, the investor makes a larger contribution.
If the portfolio rises in value above the target rate, the investor makes a smaller contribution. By following this strategy, the investor buys more shares when shares are cheaper and fewer shares when the shares are expensive.
This strategy is more complex to manage, as it does require that the investor track the portfolio performance and calculate the contribution needed for the next period to maintain a constant growth in the value of the portfolio.
It can also require large periodic additions of capital during falling markets. The table below is a spreadsheet comparison of a dollar cost averaging strategy and a value averaging strategy during a period of varying stock price.
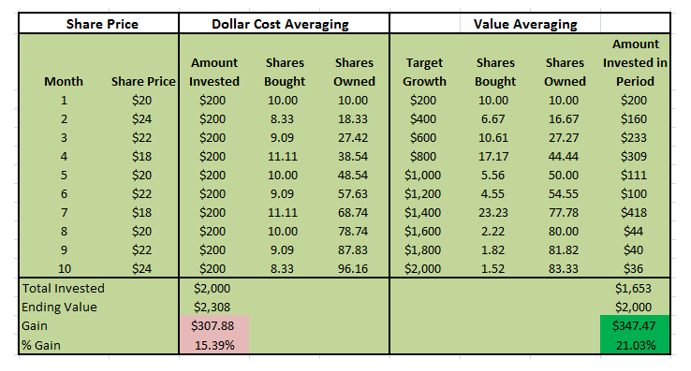
There are a number of conclusions we can draw from the table above. First and most important is that a value averaging strategy can provide a much greater return to the investor than a dollar cost averaging strategy even though the total number of shares purchased is lower and the total amount invested is lower.
The value averaging strategy does require more time and involvement from the investor, and as can be seen the “Amount Invested in Period” column, the Value Averaging strategy requires the investor to have some flexibility in the amount available to invest each period.
The use of the value averaging strategy ensures that more shares are purchased when they are cheaper and fewer shares are purchased when they are expensive, and it is more effective at doing so than a dollar cost averaging strategy.
What if the investor would prefer not to invest the time and energy required to implement a value averaging strategy or does not have the latitude in periodic investments that a value averaging strategy would require?
Is there not a strategy that investors can use to invest a fixed amount periodically that will provide improved returns over a dollar cost averaging strategy?
Buying Only the Dips versus Dollar Cost Averaging
The strategy of buying only when the target stock or mutual fund drops or takes a dip in value can provide better returns than a dollar cost averaging strategy.
Implementation of a buy the dip strategy does require the investor to follow his target stocks and/or funds in order to make investments when the valuations have dropped, and it requires the investor to have a reasonable expectation for the magnitude of the drop desired in order to make the investment.
Having an expectation of a 20% drop in valuation in order to make an investment will likely result in very little investment. So, how much variability is there in stock prices?
It has been written and said many times over that neither markets nor stocks go straight up nor straight down. Take a look at the price charts of common stocks and you will find that the volatility varies significantly between different stocks.
As an example, most electric utility stocks have rather low volatility compared to the market while high growth tech stocks or some cutting-edge health care stocks have high volatility compared to the market.
The measure of a stock’s price volatility compared to the overall market is a financial metric referred to as its Beta. Stocks with a beta of greater than 1.00 are expected to fall further when the market declines. High beta stocks should fall further during declines, but rise faster during bull markets. The opposite is true of low beta stocks.
I chose the S&P 500 index data for the last 31 years (through mid-2016 when this research was originally created) to determine the volatility and the average drop for any one month over those 31 years.
It is important to note that the market is more often up than it is down. We generally like it that way because most of us are long investors and up markets afford us the ability to grow our investments.
So, what do I mean by “average drop” for any one month? Over the last 31 years (372 months), the market has gone up in 232 of those months and gone down in 140 of those months, or down about 38% of the time.
In those 140 months where the market dropped, the average drop was 3.6%. On average, we will see market drops of 3.6% about every three months. Because the market volatility is a compendium of the volatility of all the stocks that make up the market and those individual stocks often have higher volatility (higher Beta) than the market, we can expect to see dips for individual stocks that are greater than 3.6%.
The bottom line of all this is that, as investors, we should expect daily, weekly, and monthly volatility in stock prices. We can take advantage of this volatility in timing our stock purchases.
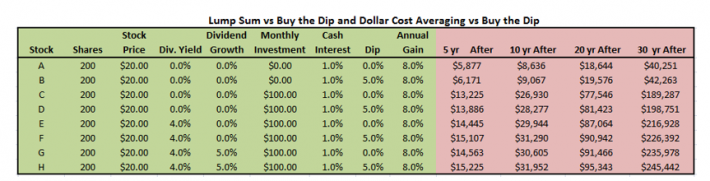
The table above shows a spreadsheet simulation of a lump sum investment at the market (stock A) versus buying on a 5% dip in the stock price (stock B).
The other six rows in the table above show the same comparison with monthly stock purchases, with a dividend of 4%, and with dividend growth of 5%.
As you would expect, buying either in a lump sum or through periodic monthly investments when the market has taken a dip (5% in the simulation above) will result in better performance than buying at the then current market price.
Yes, this strategy potentially requires the investor to time their lump sum and periodic investments while waiting for a more favorable price.
As discussed earlier, the expected market volatility should provide that opportunity to buy the dip about once every quarter. The results in the table above are corrected for the lost dividend opportunity by holding investable cash for a full quarter (3 months) in a money market account paying 1% interest.
Final Thoughts
In comparing the four strategies, it is clear that, while dollar cost averaging provides a disciplined investment approach and is relatively easy to implement, it works best in a down market with stocks that pay no dividend or only a small dividend.
If the investor has the capital available to make a lump sum investment, particularly with stocks that offer a significant dividend yield, the lump sum investment will beat dollar cost averaging under most conditions. This is particularly true if the investor has the patience to wait for a dip in the market to make that lump sum investment.
If the investor has a steady stream of investable income, the most effective investment strategies will be value averaging and buying the dips in the market.