

A Market Rally Is Imminent


Here is a pertinent question: is the US economy heading into a recession that will cause a bear market? The stock market has been through a sell-off brought on by trade war concerns, poor global economic data, and a brief yield-curve inversion, but does that mean a recession is likely? In this piece, I will outline why I think the answer to this question is no, and why I think the recent sell-off should be viewed as a buy-the-dip opportunity.
There are many economic indicators, but it is essential to determine which indicators are most useful for anticipating a recession. The mechanism that creates modern recessions is as follows: the job market weakens, people lose their jobs, they can no longer service their credit, and are unable to spend, leading the economy into a contraction, and stocks into a bear market.
I believe the job market and credit delinquency are the pertinent factors for anticipating a recession. Despite 18-months of trade uncertainty, the US job market has been robust, credit delinquency has not begun to increase, and the 10–2 yield curve has not inverted yet.
Fundamental / Economic Data
Sixty-eight percent of the American economy is based on consumer spending ($14.24 Trillion of the $21.06 Trillion for Q1 2019), therefore, having healthy consumers goes hand-in-hand with an expanding economy and a generally-increasing stock market.
Initial Claims
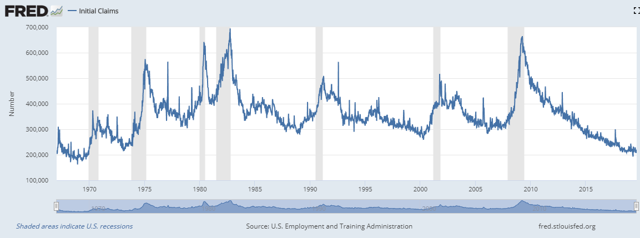
Source: FRED
The chart above outlines how initial unemployment insurance claims tend to stagnate or rise before a recession. As of now, it is still decreasing. This suggests the job market is robust, ensuring the consumer can spend, and keep the economy expanding.
Credit Delinquency
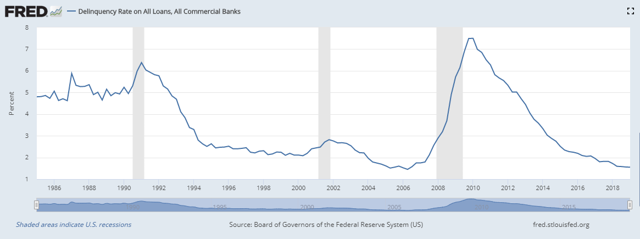
Source: FRED
The above chart shows delinquency rates on all loan types. Low credit delinquency rates correlate with a healthy job market; as long as the job market is robust, people will be able to service their credit and maintain their spending.
There are other economic indicators that are useful, but for anticipating recessions the job market and credit delinquency rates are two of the most important indicators and they are both bullish meaning recession fears are overdone.
Additionally, reliable technical indicators are signaling that this sell-off is over, and a rally should ensue.
Yield Curve Inversions
On Wednesday morning, the 10-year and 2-year treasury spread briefly went negative (a yield curve inversion). This sent shock waves through global markets and the news media, even though the inversion righted itself within hours. Additionally, this inversion was unlike prior inversions. It was brought on by quants, algos, and a global search for yield, not by weak economic conditions like in the past.
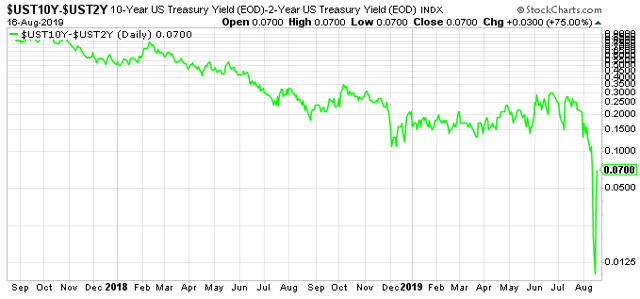
The above chart is the 10-year and 2-year treasury spread from August 2017 to the present. It illustrates two things: the yield curve has not inverted, and treasuries are experiencing highly unusual movement. The sharpness and shortness of the dip implies machine involvement; machines that were not an important factor in past inversions. The dramatic move in the rate differential also suggests that the sell-off on Wednesday was misinterpreted — it was not caused by economic factors — and overdone, thus creating a buying opportunity for those willing to go against the herd.
Economic evidence of a looming recession may be in short supply, but technical evidence of an imminent stock market rally is plentiful.
Technical Indicators
The following technical indicators suggest this sell off is over, or nearly so.
Traders Index / Arms Index
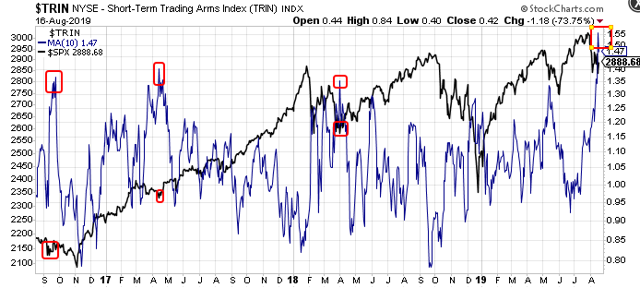
The above chart is the 10 day moving average of the TRIN (Short term traders / Arms index). This oscillator measures advancing and declining stocks, and takes into account the volume on those stocks. The blue line is the 10 Day moving average of the TRIN, while the black line is the SPX. The 10-day moving average spikes up when there is an extended sell-off. This is the largest up spike of the 10 DMA over the last three years. Over those three years, the 10 DMA eclipsed 1.35 three times (red rectangles above) with an immediate rally ensuing on 2 of those occasions, while a rally followed on the other occasion after the market made a lower low. On the most recent up spike, the 10 DMA reached 1.55, which is the highest mark since late 2015 where an immediate rally ensued.
SPX Advance Decline Percent Index

The above chart shows the 10 DMA of the SPXADP in relation to the SPX. The 10 DMA tends to shoot lower as sell-offs are nearing their end. The 10 DMA has had a large down spike and reached as low as -20. Over the last three years, this is the 6th down spike to reach this level. All five of the previous down spikes led to immediate rallies. There was one retest whereby the market rallied immediately and then sold off to the same level weeks later (Feb. and Apr. 2018). There was also one occurrence where the market rallied immediately only to make a lower low 8 weeks later (Oct. 2018). Three of the five occurrences led to immediate, multi month rallies. This suggests a broad market rally is imminent in the short term.
McClellan Oscillator
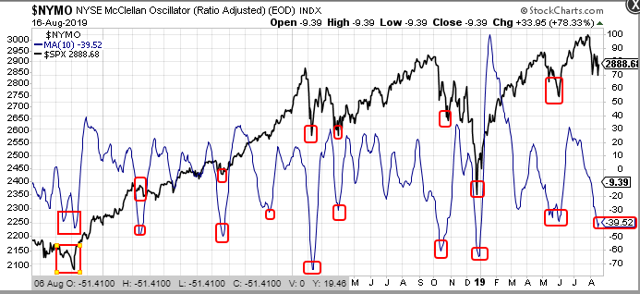
The above chart is the 10 DMA of the McClellan Oscillator in relation to the SPX. The 10 DMA on this oscillator tends to shoot down as sell-offs end. Over the last three years, the 10 DMA has eclipsed -30 on nine previous occasions. Only two of those nine occasions saw the SPX decline more. Five of the nine occasions led to immediate rallies. One of those occasions had an immediate rally that had a lower low on a multi-week basis. This supports the idea that an immediate rally will ensue in the broad market.
Equity Put Call Ratios
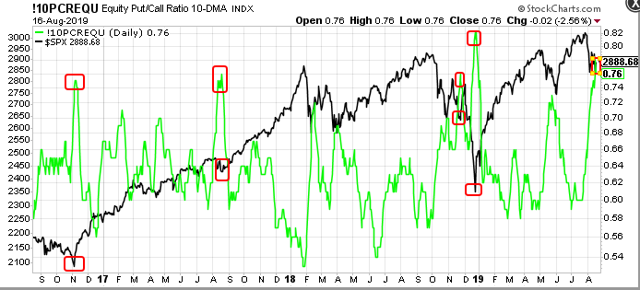
The above chart shows the 10 DMA of the Equity Put Call Ratio index and the SPX. This index shows the level of hedging that takes place on equities and shoots higher as sell-offs are nearing their end. Over the last three years, the 10 DMA of the EPC ratio index has eclipsed 0.76 on four occasions. On all four occasions, the market rallied immediately. Only on one occasion (Nov. 2018) did the market break to a lower low after the immediate rally. This supports the idea that the market is about to rally.
In summation, the pertinent economic indicators are still bullish, which means a recession and bear market are not imminent. However, breadth and sentiment technical indicators support the idea that a market rally is imminent. Buy-the-dip.
Join us at www.angtraders.com and let us keep you on the right side of the primary-trend.
Troy Trentham,
ANG Traders
Source Nicholas Gomez