


Published on November 6th, 2019 by Justin Carbonneau
We’re excited to write this guest post for Sure Dividend and we hope the information in this article providers readers a new, insightful and disciplined way to consider selecting dividend paying stocks. My firm, Validea, emulates the strategies of legendary investors (Buffett, Lynch and Graham) and other demonstrable strategies through a series of systematic investing models.
We run 22 stock selection strategies on Validea, which range from value to growth to conservative and income-oriented approaches. For Sure Dividend readers we wanted to focus on a model that combines time-tested investing factors that identify large cap blue-chip firms with market or above market yields and qualities that have produced long term market outperformance. We’ve outlined this strategy below, along with its long term back-tested returns, the top-rated stocks passing the strategy’s underlying criteria and more.
The Low-Vol Anomaly
There is an age-old concept in investing that the more risk you take, the higher the return you should get. This makes a lot of sense; investors don’t invest in risky companies to get low returns. Most hope to be compensated for that extra risk. But the tradeoff of risk and return is flipped upside down when talking about the most and least volatile stocks in the equity market. What the data shows is that the highest beta stocks underperform the stocks with lower volatility. What’s more, when you apply a volatility factor to things like size and value you get additional levels of alpha generation. As a result, the lower the risk, or volatility in stocks, the better your results could be.
This market anomaly was flushed out further in research and testing done by Pim van Vliet and his colleagues. Van Vliet is the Head of the Conservative Equities team at Robeco, a leading international asset manager. He and co-author Jan de Koning published a book, High Returns from Low Risk: A Remarkable Stock Market Paradox. The authors combine real world asset management expertise with research and long-term data to support the idea of harvesting the low volatility premium through a systematic model using volatility and other sensible fundamental factors. The book’s supplemental web site, Paradox Investing, has further information and data supporting the methodology.
Simple, Yet Effective
Van Vliet developed a factor-based model that combines three relatively simple investment criteria – volatility, momentum and net buyback yield. This is what he calls a “conservative formula” for stock selection.
Let’s look at each of these factors in the model.
- Volatility: The investable universe (the 1,000 largest companies by market cap) is separated into two groups. The 500 least volatile stocks are eligible for inclusion in the model, while the 500 most volatile are ineligible. Volatility is defined by the 3-year standard deviation of returns for each security in the universe.
- Momentum: Stocks with higher momentum are rewarded in the model. Academic studies have shown momentum tends to persist in the intermediate term, but mean revert in the short-term and long-term. As a result, stocks are ranked based on their one year momentum, excluding the most recent month.
- Net Payout Yield: Net payout yield, which is the sum of the dividend yield and the share buyback yield, partly capture the value and quality premium in stocks. The higher the net payout yield the better.
The stocks that passed the initial volatility test are ranked by the other two factors, and then a combined rank is calculated. The stocks with the best combination of momentum and net payout yield get the highest scores.
The two diagrams below visually depict how the stocks are grouped and sorted based on volatility, momentum and net payout yield.
Visualizing the Strategy
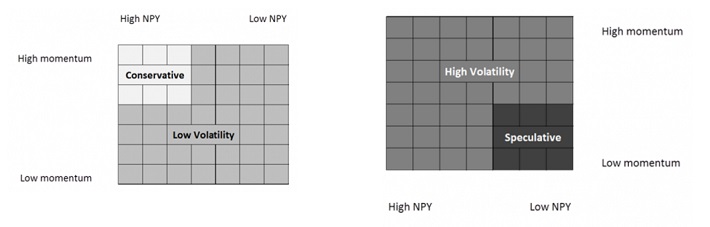
In a follow-on research paper, “The Conservative Formula: Quantitative Investing made Easy“, Van Vliet and co-author David Blitz point out that the strategy is simple and easy to understand and implement, which is different than many academic studies that may be more difficult to follow in the real world.
Conservative Compounders
Van Vliet and his collaborators tested the robustness of the conservative formula strategy over time. The chart below shows the hypothetical returns of the top ranked conservative stocks compared to the market and a portfolio of the most speculative stocks. From 1929 to 2016, the top 100 conservative stocks selected using the factors mentioned above produced an annualized return of 15.1% compared to 9.3% for the overall market and 2.1% for the most speculative stock cohort.
The conservative and speculative portfolios were made up of the 100 top ranked stocks, rebalanced quarterly. The outperformance is not just limited to the US market, as the conservative formula also produced alpha generating results in different markets, including Europe, Japan and Emerging markets. The returns below are gross of any fees and do not consider taxes.
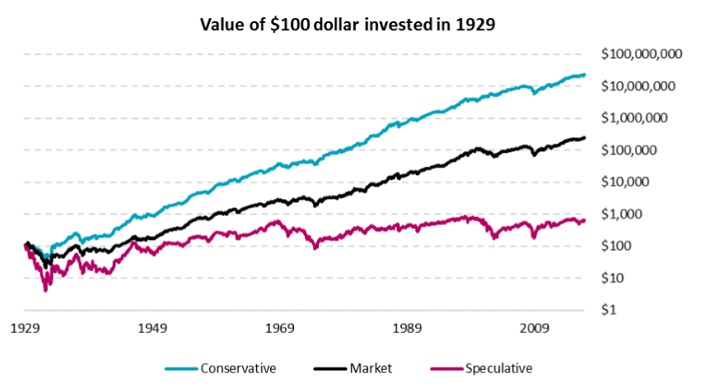
Source: The Conservative Formula: Quantitative Investing made Easy
The chart below shows the performance by decade, starting in the 1930s. The conservative stock portfolio outdid the market in 8 of the past 9 decades, and shined during the most difficult stretches (i.e. 2000-2009) for equities.
What’s more, the basket of conservative stocks never had a losing decade. As Van Vliet points out, this is important “since most investors have relatively short investment horizons” and aren’t willing to sit through long stretches of negative returns or underperformance.
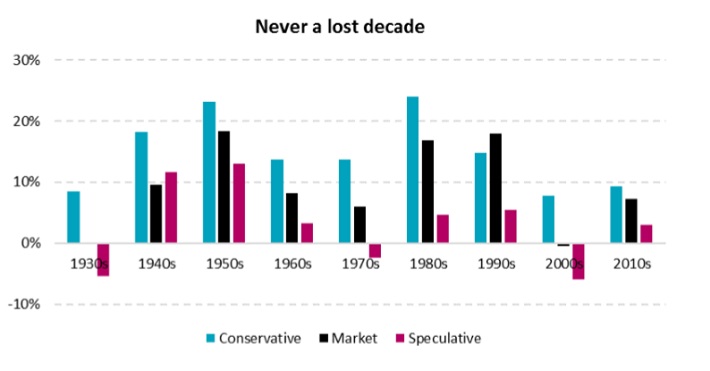
Source: The Conservative Formula: Quantitative Investing made Easy
Systematizing the Conservative Formula
Validea has codified the conservative formula strategy and has implemented it as the Multi-Factor model. We were able to build and test 10 & 20 stock focused model portfolios back to 2009. Validea’s model first starts by identifying the universe of the largest 1000 stocks, removes the most volatile 500 stocks using the three-year standard deviation of returns and the calculates both the momentum rank, using the twelve month minus one month momentum return, and the net payout yield. The top stocks, as of each portfolio rebalancing are selected and tracked in our model portfolios.
There were a few interesting observations when looking at the Multi-Factor model portfolio performance results.
- On the Validea site, we track portfolios that are rebalanced monthly, quarterly and annually. Of the 22 model portfolios we run, it’s one of the three models that performs best under the “annual” rebalancing frequency. However, both the 10 & 20 stock quarterly rebalanced portfolios also show outperformance.
- In the eight full calendar years (2010-2018), the annual portfolio only trailed the market in one year, making it one of the more consistent performers in terms of calendar year outperformance.
- The annual portfolio produces an 82% accuracy on the underlying positions. Accuracy measures the percentage of stocks that appreciate from their buy price. What this is saying is that 8.2 out of every 10 stocks added to the portfolio go on to generate positive returns when held in the portfolio. In looking across all of our models and portfolio iterations, this is by far one of the very top strategies in terms of picking stocks that go on to produce positive gains.
The performance chart and statistics below show the Annual re-balanced Multi-Factor model going back to mid-2009, which is a far back Validea was able to test the strategy.
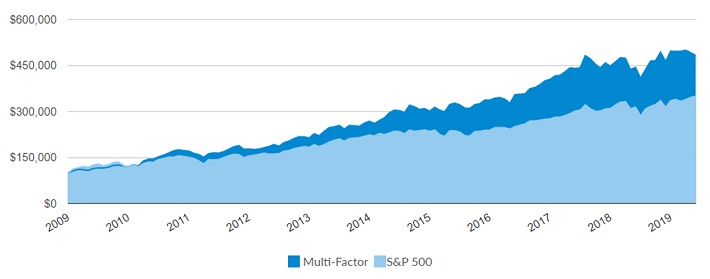
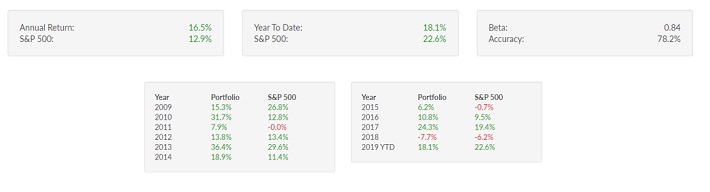
Source: Multi-Factor Investor 10 Stock Annually Re-Balanced Portfolio (as of 11/5/2019)
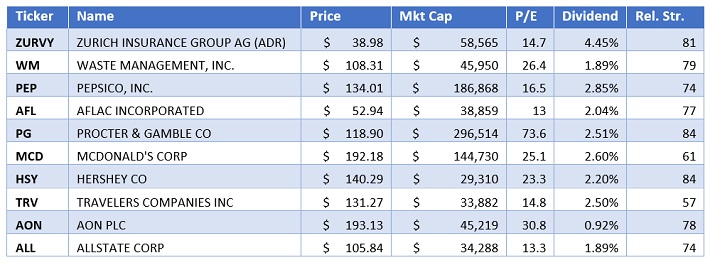
Current Top Scoring Stocks
Because we run the model real-time on Validea, we can create portfolios and screens that look to identify those stocks that meet the model’s underlying criteria. Below are the current top scoring names in the portfolio as November 5th, 2019. These names get 100% according to eh model, as you can see the dividend yields are all healthy. The non-US stocks ADR names, like Zurich Insurance and Toyota carry some of the highest dividend yields, which is not a surprise given the relative undervaluation in many international stocks.
In the world of FAANG stocks and recent and upcoming IPOs like Uber, Zoom, WeWork, stocks labeled “conservative” or “low volatility” may sound boring or stodgy. But as Van Vliet and his fellow researchers showed in their testing and as the Validea Multi-Factor model indicates, buying stocks with low volatility and coupling that with price momentum and net payout yield can lead to some very promising long-term results over many different market environments.
Justin Carbonneau is a partner at Validea.com and Validea Capital Management, LLC. You can learn more about firm’s investing system and 22 guru-inspired model portfolios at www.validea.com.