


Updated on November 8th, 2019 by Bob Ciura
Spreadsheet data updated daily
Master limited partnerships – or MLPs, for short – are some of the most misunderstood investment vehicles in the public markets.
And that’s a shame, because the typical MLP offers:
- Tax-advantaged income
- High yields well in excess of market averages
- The bulk of corporate cash flows returned to shareholders through distributions
An example of a ‘normal’ MLP is an organization involved in the midstream energy industry. Midstream energy companies are in the business of transporting oil, primarily though pipelines. Pipeline companies make up the vast majority of MLPs.
So how can you find publicly-traded MLPs suitable for investment? Using the MLP Excel Spreadsheet available for download below is a great place to start:
This comprehensive article covers MLPs in depth. The table of contents below gives an overview of what this article contains.
Table of Contents
- The Complete List of MLPs
- The History of Master Limited Partnerships
- MLP Tax Consequences
- 5 Advantages & 6 Disadvantages of Investing in MLPs
-
The 10 Best MLPs Today
#10: Sunoco LP (SUN)
#9: Suburban Propane Partners (SPH)
#8: Holly Energy Partners j(HEP)
#7: NextEra Energy Partners (NEP)
#6: Enterprise Products Partners (EPD)
#5: MPLX LP (MPLX)
#4: Magellan Midstream Partners (MMP)
#3: Genesis Energy (GEL)
#2: Energy Transfer (ET)
#1: EQM Midstream Partners (EQM) - MLP ETFs, ETNs, & Mutual Funds
- Final Thoughts
The Complete List of MLPs
The sortable table below summarizes the information in our free Excel spreadsheet. It gives you the ability to quickly find the largest MLPs by market cap, the highest yielding MLPs, and more.
| AB | AllianceBernstein Holding LP | 29.57 | 8.0 | 2,838.5 | 13.0 | 104.4 |
| AM | Antero Midstream Corp. | 6.42 | 14.3 | 3,232.0 | -21.2 | -303.3 |
| AMGP | Antero Midstream GP LP | 12.54 | 3.6 | 2,335.4 | 38.6 | 139.1 |
| AMID | Third Coast Midstream LLC | 5.24 | 0.0 | 284.1 | -7.4 | 0.0 |
| ANDV | Andeavor | 0.00 | 0.0 | 0.0 | ||
| ANDX | Andeavor Logistics LP | 32.17 | 12.8 | 7,901.9 | 12.6 | 162.0 |
| APO | Apollo Global Management, Inc. | 42.57 | 4.7 | 17,810.8 | 20.7 | 96.5 |
| APU | AmeriGas Partners LP | 31.22 | 12.2 | 2,903.5 | 36.9 | 449.2 |
| ARES | Ares Management Corp. | 32.15 | 3.9 | 7,436.8 | 36.2 | 139.8 |
| ARLP | Alliance Resource Partners LP | 11.71 | 18.2 | 1,503.5 | 3.6 | 65.7 |
| ATAX | America First Multifamily Investors LP | 7.69 | 6.5 | 467.8 | 16.1 | 104.6 |
| ATLS | Atlas Energy Group LLC | 0.01 | 0.0 | 0.4 | -0.1 | 0.0 |
| BEP | Brookfield Renewable Partners LP | 43.00 | 4.7 | 13,268.3 | 142.3 | 664.7 |
| BIP | Brookfield Infrastructure Partners LP | 50.13 | 3.9 | 20,423.7 | -2,638.4 | -10,236.8 |
| BKEP | BlueKnight Energy Partners LP | 1.16 | 20.7 | 47.3 | -0.8 | -15.9 |
| BPL | Buckeye Partners LP | 41.46 | 7.2 | 6,381.6 | 8.3 | 60.4 |
| BPY | Brookfield Property Partners LP | 18.79 | 6.9 | 16,474.5 | 12.2 | 84.7 |
| BSM | Black Stone Minerals LP | 13.08 | 11.3 | 2,694.0 | 8.5 | 95.8 |
| BX | The Blackstone Group, Inc. | 51.40 | 4.2 | 61,239.1 | 28.6 | 120.6 |
| CCLP | CSI Compressco LP | 2.67 | 8.1 | 125.7 | ||
| CCR | CONSOL Coal Resources LP | 11.17 | 18.4 | 179.0 | 5.9 | 108.2 |
| CELP | Cypress Energy Partners LP | 9.37 | 9.0 | 113.0 | 11.1 | 99.7 |
| CEQP | Crestwood Equity Partners LP | 32.06 | 7.5 | 2,332.0 | 9.4 | 70.6 |
| CG | The Carlyle Group LP | 27.50 | 5.3 | 9,533.1 | 9.0 | 48.3 |
| CINR | Ciner Resources LP | 19.04 | 9.5 | 375.8 | 7.3 | 69.3 |
| CLMT | Calumet Specialty Products Partners LP | 3.47 | 0.0 | 269.1 | 255.1 | 0.0 |
| CNXM | CNX Midstream Partners LP | 14.44 | 10.2 | 920.4 | 6.3 | 64.5 |
| CODI | Compass Diversified Holdings | 22.09 | 6.5 | 1,323.2 | -11.5 | -74.8 |
| CPLP | Capital Product Partners LP | 11.43 | 15.3 | 207.8 | -1.3 | -20.5 |
| CQP | Cheniere Energy Partners LP | 42.54 | 5.6 | 20,589.4 | 28.9 | 161.8 |
| CVRR | CVR Refining, LP | 0.00 | 0.0 | 0.0 | ||
| DCP | DCP Midstream LP | 23.60 | 13.2 | 3,382.3 | -31.6 | -417.8 |
| DKL | Delek Logistics Partners LP | 32.38 | 9.9 | 790.6 | 13.1 | 129.4 |
| DLNG | Dynagas LNG Partners LP | 2.11 | 38.5 | 74.9 | -9.1 | -352.2 |
| DM | Dominion Energy Midstream Partners, LP | 0.00 | 0.0 | 0.0 | ||
| DMLP | Dorchester Minerals LP | 17.70 | 10.8 | 613.8 | 10.6 | 114.3 |
| ECT | ECA Marcellus Trust I | 0.88 | 36.2 | 15.5 | 3.0 | 109.1 |
| EEP | Enbridge Energy Partners, L.P. | 0.00 | 0.0 | 0.0 | ||
| EFC | Ellington Financial, Inc. | 18.58 | 9.7 | 627.5 | 13.3 | 128.8 |
| EMES | Emerge Energy Services LP | 0.21 | 0.0 | 6.5 | 0.5 | 0.0 |
| ENBL | Enable Midstream Partners LP | 10.35 | 12.4 | 4,503.4 | 8.7 | 108.4 |
| ENLC | EnLink Midstream LLC | 5.95 | 18.4 | 3,251.1 | -7.6 | -140.3 |
| ENLK | EnLink Midstream Partners, LP | 0.00 | 0.0 | 0.0 | ||
| EPD | Enterprise Products Partners LP | 26.43 | 6.6 | 57,855.5 | ||
| EQGP | EQGP Holdings, LP | 0.00 | 0.0 | 0.0 | ||
| EQM | EQM Midstream Partners LP | 26.64 | 17.1 | 5,340.2 | 22.1 | 377.6 |
| ETE | Energy Transfer Equity, L.P. | 0.00 | 0.0 | 0.0 | ||
| ETP | Energy Transfer Partners, L.P. | 0.00 | 0.0 | 0.0 | ||
| EVA | Enviva Partners LP | 34.99 | 7.4 | 1,170.7 | -205.8 | -1,517.6 |
| FELP | Foresight Energy LP | 0.17 | 68.5 | 24.8 | -0.4 | -27.7 |
| FGP | Ferrellgas Partners LP | 0.59 | 0.0 | 57.3 | -0.9 | 0.0 |
| FUN | Cedar Fair LP | 55.69 | 6.6 | 3,151.9 | 21.5 | 142.5 |
| GEL | Genesis Energy LP | 19.76 | 11.1 | 2,423.0 | -97.1 | -1,075.6 |
| GLOP | GasLog Partners LP | 18.43 | 11.8 | 867.1 | 14.4 | 170.7 |
| GLP | Global Partners LP | 20.33 | 9.6 | 691.1 | 13.0 | 124.9 |
| GMLP | Golar LNG Partners LP | 9.71 | 18.4 | 688.4 | 73.0 | 1,345.9 |
| GPP | Green Plains Partners LP | 14.00 | 13.6 | 324.3 | 7.7 | 104.2 |
| HCLP | Hi-Crush Partners LP | 2.30 | 0.0 | 232.5 | 2.5 | 0.0 |
| HEP | Holly Energy Partners LP | 23.06 | 11.6 | 2,431.4 | 10.7 | 124.4 |
| HESM | Hess Midstream Partners LP | 21.21 | 7.1 | 1,158.6 | 17.1 | 121.8 |
| HMLP | Höegh Lng Partners LP | 14.46 | 12.2 | 481.0 | 11.2 | 136.1 |
| IEP | Icahn Enterprises LP | 67.36 | 11.5 | 13,576.5 | 20.5 | 236.0 |
| JMP | JMP Group LLC | 3.28 | 7.0 | 63.4 | -93.4 | -655.3 |
| KKR | KKR & Co., Inc. | 29.05 | 1.7 | 24,441.8 | 14.8 | 25.5 |
| KNOP | KNOT Offshore Partners LP | 19.12 | 10.9 | 625.1 | 12.8 | 139.1 |
| KRP | Kimbell Royalty Partners LP | 14.28 | 11.6 | 669.9 | -14.3 | -165.7 |
| LGCY | Legacy Reserves, Inc. | 0.06 | 0.0 | 6.8 | ||
| LMRK | Landmark Infrastructure Partners LP | 16.52 | 8.9 | 418.6 | 81.7 | 726.6 |
| MCEP | Mid-Con Energy Partners LP | 0.34 | 0.0 | 10.5 | 2.1 | 0.0 |
| MMLP | Martin Midstream Partners LP | 4.71 | 31.8 | 183.0 | -1.0 | -32.6 |
| MMP | Magellan Midstream Partners LP | 59.55 | 6.7 | 13,601.4 | 13.0 | 86.9 |
| MPLX | MPLX LP | 24.92 | 10.5 | 26,345.2 | 10.8 | 113.5 |
| NAP | Navios Maritime Midstream Partners L.P. | 0.00 | 0.0 | 0.0 | ||
| NBLX | Noble Midstream Partners LP | 22.89 | 10.0 | 909.9 | 5.9 | 58.7 |
| NEN | New England Realty Associates LP | 59.70 | 2.1 | 182.6 | 39.9 | 82.8 |
| NGL | NGL Energy Partners LP | 10.48 | 14.9 | 1,341.9 | 4.0 | 60.2 |
| NMM | Navios Maritime Partners LP | 18.92 | 6.3 | 207.8 | 141.5 | 897.5 |
| NRP | Natural Resource Partners LP | 21.44 | 8.4 | 262.9 | 2.4 | 19.9 |
| NS | NuStar Energy LP | 28.87 | 8.3 | 3,111.1 | -10.8 | -89.5 |
| OAK | Oaktree Capital Group LLC | 51.52 | 5.9 | 3,907.4 | 17.1 | 101.3 |
| OZM | Sculptor Capital Management, Inc. | 21.74 | 4.6 | 1,507.9 | 36.9 | 169.6 |
| PAA | Plains All American Pipeline LP | 18.35 | 7.2 | 13,359.3 | 4.8 | 34.6 |
| PAGP | Plains GP Holdings LP | 18.60 | 7.1 | 15,104.1 | 6.5 | 45.8 |
| PBFX | PBF Logistics LP | 21.61 | 9.4 | 1,342.2 | 12.7 | 119.7 |
| POPE | Pope Resources LP | 77.95 | 4.9 | 339.5 | 54.3 | 264.8 |
| PSXP | Phillips 66 Partners LP | 54.36 | 6.1 | 12,370.9 | 12.0 | 73.4 |
| RHNO | Rhino Resource Partners LP | 0.46 | 0.0 | 7.3 | -0.1 | 0.0 |
| SDLP | Seadrill Partners LLC | 1.22 | 180.3 | 9.2 | 0.0 | -6.8 |
| SEP | Spectra Energy Partners, LP | 0.00 | 0.0 | 0.0 | ||
| SGU | Star Group LP | 9.10 | 5.2 | 448.5 | 21.2 | 111.2 |
| SHLX | Shell Midstream Partners LP | 20.44 | 8.0 | 4,768.4 | 11.7 | 93.1 |
| SMLP | Summit Midstream Partners LP | 4.65 | 43.3 | 384.6 | 11.0 | 476.9 |
| SNMP | Sanchez Midstream Partners LP | 0.36 | 250.2 | 7.2 | -0.3 | -73.2 |
| SPH | Suburban Propane Partners LP | 23.56 | 10.2 | 1,454.5 | 21.1 | 215.2 |
| SPLP | Steel Partners Holdings LP | 12.25 | 3.1 | 306.4 | 349.0 | 1,068.4 |
| SRLP | Sprague Resources LP | 17.42 | 15.3 | 396.0 | 10.2 | 155.6 |
| STON | StoneMor Partners LP | 1.15 | 0.0 | 49.0 | -0.5 | 0.0 |
| SUN | Sunoco LP | 32.41 | 10.2 | 3,213.8 | 26.9 | 273.7 |
| SXCP | SunCoke Energy Partners LP | 12.54 | 12.8 | 579.7 | 11.9 | 151.5 |
| SXE | Southcross Energy Partners, L.P. | 0.27 | 0.0 | 25.6 | -0.3 | 0.0 |
| TCP | TC Pipelines LP | 40.07 | 6.5 | 2,933.4 | -13.5 | -87.4 |
| TGP | Teekay LNG Partners LP | 13.93 | 4.4 | 1,092.1 | 25.0 | 109.7 |
| TLP | TransMontaigne Partners L.P. | 40.99 | 7.6 | 665.2 | 24.3 | 183.8 |
| TOO | Teekay Offshore Partners LP | 1.54 | 0.0 | 632.5 | -18.1 | 0.0 |
| UAN | CVR Partners LP | 3.09 | 10.7 | 350.0 | -30.6 | -326.4 |
| USAC | USA Compression Partners LP | 17.73 | 11.8 | 1,826.2 | -196.1 | -2,323.0 |
| USDP | USD Partners LP | 9.95 | 14.5 | 263.7 | 45.4 | 659.5 |
| VLP | Valero Energy Partners LP | 0.00 | 0.0 | 0.0 | ||
| VNOM | Viper Energy Partners LP | 24.16 | 8.0 | 3,263.2 | 31.8 | 255.6 |
| WES | Western Midstream Partners LP | 19.80 | 12.3 | 8,969.6 | 14.5 | 177.4 |
| WGP | Western Midstream Partners LP | 33.46 | 6.9 | 7,163.7 | 19.8 | 136.0 |
| WLKP | Westlake Chemical Partners LP | 23.61 | 7.4 | 830.8 | 14.4 | 107.0 |
| WMLP | Westmoreland Resource Partners, LP | 0.00 | 0.0 | 0.0 | ||
| WPZ | Williams Partners L.P. | 0.00 | 0.0 | 0.0 | ||
| Ticker | Name | Price | Dividend Yield | Market Cap ($M) | P/E Ratio | Payout Ratio |
Additionally, you can download our sortable MLP spreadsheet and save it for access any time.
The History of Master Limited Partnerships
MLPs were created in 1981 to allow certain business partnerships to issue publicly traded ownership interests.
The first MLP was Apache Oil Company, which was quickly followed by other energy MLPs, and then real estate MLPs.
The MLP space expanded rapidly until a great many companies from diverse industries operated as MLPs – including the Boston Celtics basketball team.
Below, you can see a diagram showing the change in the sector concentration of MLPs over time.
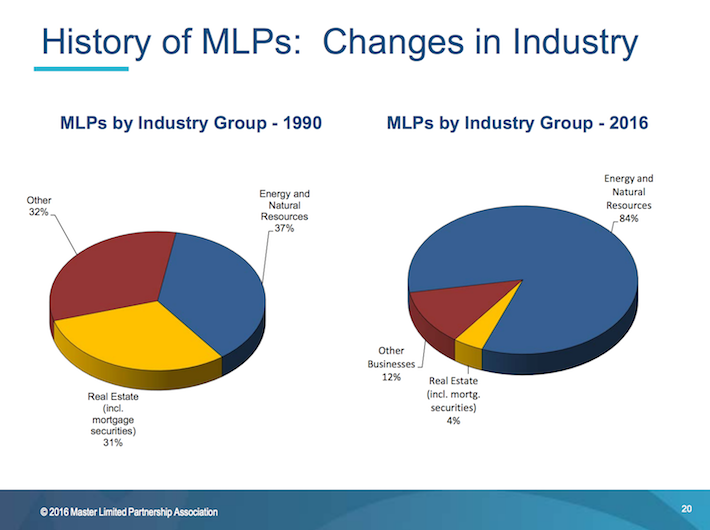
Source: Master Limited Partnership Association ‘MLP 101’ Presentation, slide 20
One important trend that can be seen in the diagram above is that energy MLPs have grown from being roughly one-third of the total MLP universe to containing the vast majority of these securities.
Moreover, the energy MLP universe has evolved to be focused on midstream energy operations. Midstream partnerships have grown to be roughly half of the total number of energy MLPs.
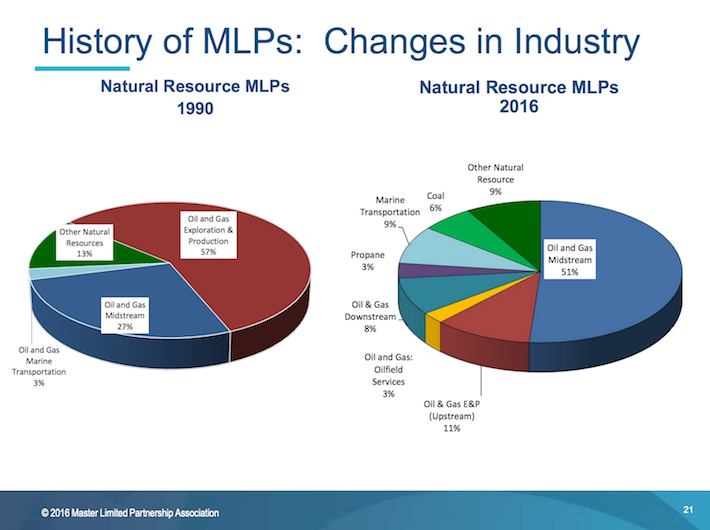
Source: Master Limited Partnership Association ‘MLP 101’ Presentation, slide 21
MLP Tax Consequences
Master limited partnerships are tax-advantaged investment vehicles. They are taxed differently than corporations.
MLPs are pass-through entities. They are not taxed at the entity level. Instead, all money distributed from the MLP to unit holders is taxed at the individual level.
Distributions are ‘passed through’ because MLP investors are actually limited partners in the MLP, not shareholders. Because of this, MLP investors are called unit holders, not shareholders. And, the money MLPs pay out to unit holders is called a distribution (not a dividend).
The money passed through from the MLP to unit holders is classified as either:
- Return of Capital
- Ordinary Income
MLPs tend to have lots of depreciation and other non-cash charges. This means they often have income that is far lower than the amount of cash they can actually distribute. The cash distributed less the MLPs income is a return of capital.
A return of capital is not technically income, from an accounting and tax perspective. Instead, it is considered as the MLP actually returning a portion of its assets to unit holders.
Now here’s the interesting part… Returns of capital taxes reduce your cost basis, and are only due when you sell your MLP units. Returns of capital are tax-deferred.
Note: Return of capital taxes are also due on the amount that your cost basis is less than $0. This only happens in the event of very long-term holding, typically around 10 years or more.
Each individual MLP is different, but on average an MLPs distribution is usually around 80% to 90% a return of capital, and 10% to 20% ordinary income.
This works out very well from a tax perspective. The images below compare what happens when a corporation and an MLP each have the same amount of cash to send to investors.
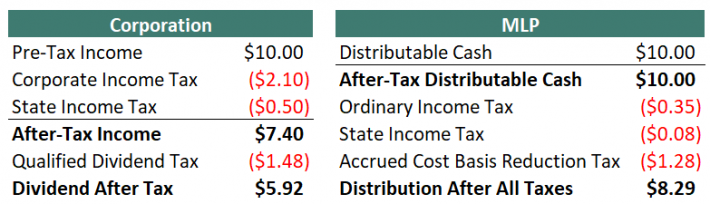
Note 1: Taxes are never simple. Some reasonable assumptions had to be made to simplify the table above. These are listed below:
- Corporate federal income tax rate of 21%
- Corporate state income tax rate of 5%
- Qualified dividend tax rate of 20%
- Distributable cash is 80% a return of capital, 20% ordinary income
- Personal federal tax rate of 22% less 20% for passive entity tax break
(19.6% total instead of 22%) - Personal state tax rate of 5% less 20% for passive entity tax break
(4% total instead of 5%) - Long-term capital gains tax rate of 20% less 20% for passive entity tax break
(16% total instead of 20%)
Note 2: The 20% passive income entity tax break is part of President Trump’s new tax plan, and will expire in 2025.
Note 3: In the MLP example, if the maximum personal tax rate of 37% is used, the distribution after all taxes is $8.05.
Note 4: In the MLP example, the accrued cost basis reduction tax is due when the MLP is sold, not annually come tax time.
As the tables above show, MLPs are far more efficient vehicles for returning cash to shareholders relative to corporations. Additionally, in the example above $9.57 out of $10.00 distribution would be kept by the MLP investor until they sold because the bulk of taxes are from returns of capital and not due until the MLP is sold.
Return of capital and other issues discussed above do not matter when MLPs are held in a retirement account.
There is a different issue with holding MLPs in a retirement account, however. This includes 401(k), IRA, and Roth IRA accounts, among others.
When retirement plans conduct or invest in a business activity, they must file separate tax forms to report Unrelated Business Income (UBI) and may owe Unrelated Business Taxable Income (UBTI). UBTI tax brackets go up to 37% (the top personal rate).
MLPs issue K-1 forms for tax reporting. K-1s report business income, expense, and loss to owners. Therefore, MLPs held in retirement accounts may still qualify for taxes.
If UBI for all holdings in your retirement account is over $1,000, you must have your retirement account provider (typically, your brokerage) file Form 990-T. You will want to file form 990-T as well if you have a UBI loss to get a loss carryforward for subsequent tax years. Failure to file form 990-T and pay UBIT can lead to severe penalties. Fortunately, UBIs are often negative. It is a fairly rare occurrence to owe taxes on UBI.
The subject of MLP taxation can be complicated and confusing. Hiring a tax professional to aid in preparing taxes is a viable option for dealing with the complexity.
The bottom line is this: MLPs are tax-advantaged vehicles that are suited for investors looking for current income. It is fine to hold them in either taxable or non-taxable (retirement) accounts. Since retirement accounts are already tax-deferred, holding MLPs in taxable accounts allows you to ‘get credit’ for the full effects of their unique structure.
5 Advantages & 6 Disadvantages of Investing in MLPs
MLPs are a unique asset class. As a result, there are several advantages and disadvantages to investing in MLPs. Many of these advantages and disadvantages are unique specifically to MLPs.
Advantages of MLPs
Advantage #1: Lower taxes
MLPs are tax-advantaged securities, as discussed in the “Tax Consequences” section above. Depending on your individual tax bracket, MLPs are able to generate around 40% more after-tax income for every pre-tax dollar they decide to distribute, versus Corporations.
Advantage #2: Tax-deferred income through returns of capital
In addition to lower taxes in general, 80% to 90% of the typical MLPs distributions are classified as returns of capital. Taxes are not 0wed (unless cost basis falls below 0) on return of capital distributions until the MLP is sold. This creates the favorable situation of tax-deferred income.
Tax-deferred income is especially beneficial for retirees as return on capital taxes may not need to be paid throughout retirement.
Advantage #3: Diversification from other asset classes
Investing in MLPs provides significant diversification in a balanced portfolio. Diversification can be measured by the correlation in return series between asset classes. The image below shows the correlations between the largest MLP ETF (AMLP) and several other asset classes from 8/25/2010 (which is the first day the AMLP ETF was publicly traded) through 9/11/2018.
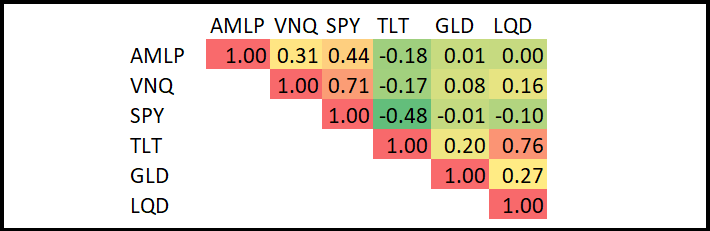
In the image above, the tickers above represent the following asset classes:
- AMLP, MLPs
- VNQ, Real Estate Investment Trusts [REITs]
- SPY, S&P 500
- TLT, Long-Term US Treasuries
- GLD, Gold
- LQD, Corporate Bonds
MLPs are excellent diversifiers, having either a near zero or negative correlation to corporate bonds, government bonds, and gold. Additionally, they have a correlation coefficient of less than 0.5 to both REITs and the S&P 500. This makes MLPs an excellent addition to a diversified portfolio.
Advantage #4: Typically very high yields
MLPs tend to have yields far in excess of the broader market. As of this writing, the S&P 500 yields 1.7%, while the Alerian MLP ETF (AMLP) yields 7.6%. Many individual MLPs have yields above 10%.
Advantage #5: Excellent historical total returns
Finally, MLPs have generated excellent returns as an asset class.
The typically high dividend yields of master limited partnerships are a large reason why these entities have outperformed other asset classes in recent history.
The performance of energy MLPs is compared to the other major asset classes in the following diagram.
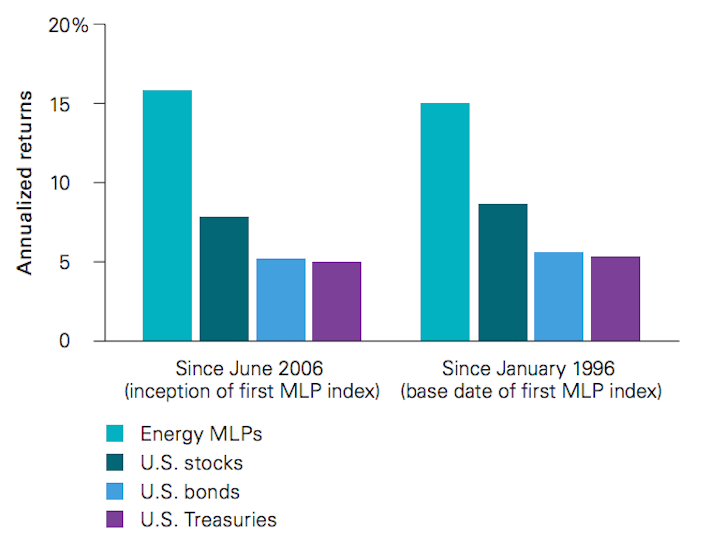
Source: Vanguard: User’s Guide To Master Limited Partnerships
Disadvantages of MLPs
Disadvantage #1: Complicated tax situation
MLPs can create a headache come tax season. MLPs issue K-1’s and are generally more time-consuming and complicated to correctly calculate taxes than ‘normal’ stocks.
Disadvantage #2: Potential additional paperwork if held in a retirement account
In addition, MLPs create extra paperwork and complications when invested through a retirement account because they potentially create unrelated business income (UBI). See the “Tax Consequences” section above for more on this.
Disadvantage #3: Little diversification within the MLP asset class
While MLPs provide significant diversification versus other asset classes, there is little diversification within the MLP structure. The vast majority of publicly traded MLPs are oil and gas pipeline businesses. There are some exceptions, but in general MLP investors are investing in energy pipelines and not much else. Because of this, it would be unwise to allocate all or a majority of one’s portfolio to this asset class.
Disadvantage #4: Incentive Distribution Rights (IDRs)
MLP investors are limited partners in the partnership. The MLP form also has a general partner. The general partner is usually the management and ownership group that controls the MLP, even if they own a very small percentage of the actual MLP.
Incentive Distribution Rights, or IDRs, are used to ‘incentivize’ the general partner to grow the MLP. IDRs typically allocate greater percentages of cash flows to go to the general partner (and not to the limited partners) as the MLP grows its cash flows. This reduces the MLPs ability to grow its distributions, putting a handicap on distribution increases.
It should be noted that not all MLPs have IDRs, but the majority do.
Disadvantage #5: Elevated risk of distribution cuts due to high payout ratios
One of the big advantages of investing in MLPs is their high yields. Unfortunately, high yields very often come with high payout ratios.
Most MLPs distribute nearly all of the cash flows they make to unit holders. In general, this is a positive. However, it creates very little room for error. The pipeline business is generally stable, but if cash flows decline unexpectedly, there is almost no margin of safety at many MLPs. Even a short-term disturbance in business results can necessitate a reduction in the distribution.
Disadvantage #6: Growth Through Debt & Share Issuances
Since MLPs typically distribute virtually all of their cash flows as distributions, there is very little money left over to actually grow the partnership.
And most MLPs strive to grow both the partnership, and distributions, over time. To do this, the MLP’s management must tap capital markets by either issuing new units or taking on additional debt.
When new units are issued, existing unit holders are diluted; their percentage of ownership in the MLP is reduced. When new debt is issued, more cash flows must be used to cover interest payments instead of going into the pockets of limited partners through distributions.
If an MLPs management team starts projects with lower returns than the cost of their debt or equity capital, it destroys unit holder value. This is a real risk to consider when investing in MLPs.
The 10 Best MLPs Today
The 10 best MLPs are ranked and analyzed below using expected total returns from the Sure Analysis Research Database. Expected total returns consist of 3 elements:
- Return from change in valuation multiple
- Return from distribution yield
- Return from growth on a per-unit basis
Continue reading for detailed analysis on each of our top 10 MLPs by expected annual returns, ranked in order of lowest to highest.
MLP #10: Sunoco LP (SUN)
- Expected 5-year Annual Returns: 10.4%
Sunoco is a master limited partnership that distributes fuel products through its wholesale and retail business units. The wholesale unit purchases fuel products from refiners and sells those products to both its own and independently-owned dealers. The retail unit operates stores where fuel products as well as other products such as convenience products and food are sold to customers. Sunoco was founded in 2012, is headquartered in Dallas, TX, and currently trades with a market capitalization of $2.7 billion.
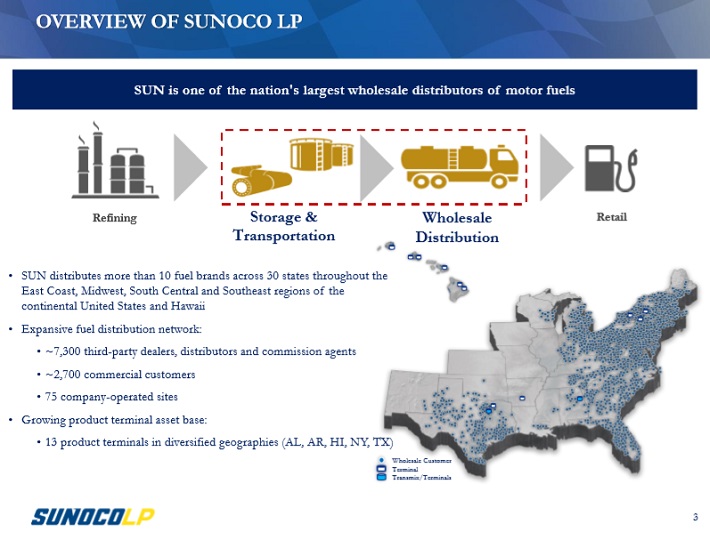
Source: Investor Presentation
Sunoco reported its third-quarter earnings results on November 6th. Adjusted EBITDA and distributable cash flow declined 7.7% and 11%, respectively, compared with the same quarter last year. Excluding a one-time cash benefit of $25 million, adjusted EBITDA and distributable cash flow would have grown by a small amount. Growth was driven by record fuel volumes of 2.11 billion.
Sunoco reported current quarter cash coverage of 1.55x, and trailing twelve month coverage of 1.30x which indicates a secure distribution. At the same time, investors should keep a close eye on the company’s debt levels, as Sunoco ended the quarter with a leverage ratio of net debt to adjusted EBITDA, of 4.51x.
Sunoco does not have a long history, as the company was created just a few years ago. During that time frame its results varied significantly. Going forward, Sunoco can generate growth through multiple factors. Following the sale of a large amount of its convenience stores, Sunoco is now more dependent on its fuel wholesale business, where it profits from significant scale and revenue consistency.
In Texas, Sunoco is one of the largest independent fuel distributors, and Sunoco is also among the top distributors of Chevron, Exxon, and Valero-branded motor fuel in the rest of the United States. In the fuel wholesale industry, scale is important, as increased scale allows for higher margins and a better negotiating position with both suppliers and customers. Total gasoline sales declined relatively steadily since the beginning of the current millennium, but bottomed in 2015 and started to rise again over the last three years.
This macro shift towards higher gasoline consumption, can be explained by customers’ preference for larger, less efficient models such as SUVs and trucks. Higher gasoline demand is a macro tailwind for Sunoco’s business.
Overall, we expect annual returns in the low double-digits, fueled mostly by the current yield of 10.4%, while the EBITDA-per-unit growth will likely be modest and only offset a slightly negative impact from valuation changes.
MLP #9: Suburban Propane Partners (SPH)
- Expected 5-year Annual Returns: 11.8%
Suburban Propane has been in operation since 1928 and became a Master Limited Partnership in 1996. The partnership services most of the U.S. with propane and other energy sources, although propane does make up around 90% of total revenue. It has a market capitalization of $1.4 billion and should generate that same amount in revenue this year. The partnership has over 3,000 full-time employees in 41 states, serving approximately 1 million customers.
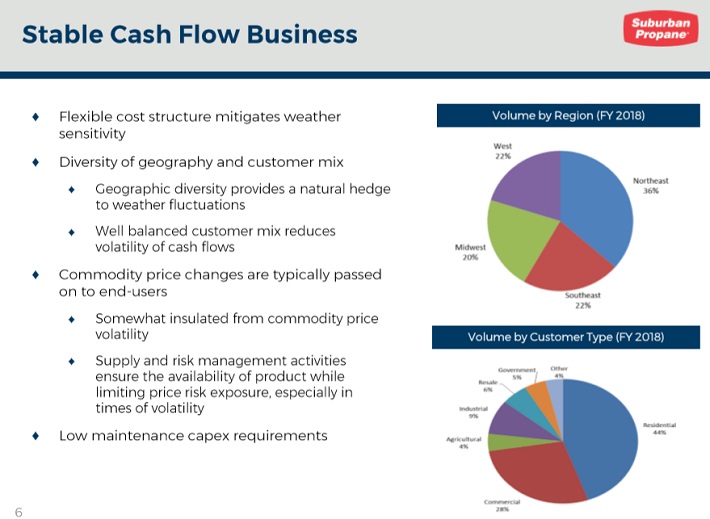
Source: Investor Presentation
Suburban reported third-quarter results on 8/8/19, in which the partnership generated $20.1 million in adjusted EBITDA, down from $30.5 million in the same year-ago period. Consistent with its history, the partnership generated a loss in fiscal Q3 of $0.47 per common unit, up from a loss of $0.27 per common unit in the 2018 third quarter. The main driver of this declining year-over-year performance was significantly warmer-than-average temperatures during April, while April 2018 saw significantly cooler-than-average weathers.
As a result, customers used less propane to warm their homes, leading to declining volumes during the quarter. This also had the additional compound effect of reducing propane prices, combining with operating leverage to generate lower profit margins. Additionally, combined operating and G&A expenses grew by 2.9% year-over-year. A bright spot for future growth was that the partnership acquired two well-run propane operations in strategic markets for Suburban while also reducing debt by $16.3 million. Their consolidated leverage ratio now stands at 4.41x.
Cash flow has been predictably volatile during the past decade as again, it fluctuates depending on weather conditions. It relies heavily upon heating demand so when temperatures are warmer than normal – as they have been for the past two years – results suffer. Last year was a return to more normalized temperatures, although we are still far from average.
Suburban recently cut its distribution after it became clear it was unsustainable. The partnership had been borrowing to pay the distribution so cutting it made sense, but even with the lower distribution, the much lower stock price has driven the yield up significantly. Importantly, we forecast that cash flow will amply cover the distribution in the coming years, so another cut should not be necessary.
We expect total annual returns of 11.8% per year through 2024, comprised of the 10.2% dividend yield, 1.5% annual cash flow-per-unit growth, and a very small 0.1% boost from valuation expansion.
MLP #8: Holly Energy Partners (HEP)
- Expected 5-year Annual Returns: 12.1%
As a midstream Master Limited Partnership, or MLP, Holly Energy Partners (HEP) is responsible for transporting and storing crude oil and refined products. The company operates its own crude oil and petroleum pipelines and storage terminals in ten U.S. states, including Texas, Nevada and Washington. HEP also has refinery facilities in Utah and Kansas. HEP was founded in 2004 by HollyFrontier (HFC) and generates revenue by charging customers a fee for transporting and storing petroleum products.
Nearly all the revenues of HEP are fee-based. Thus, these revenues are not affected by prevailing commodity prices. Instead they are proportional to the volumes transported and stored by the MLP. These volumes are reliable because they are determined by long-term contracts, which pose strict minimums to the customers of the MLP. As a result, in the recent downturn of the oil market during 2014-2017, while other MLPs saw their earnings collapse, HEP grew its earnings-per-share and its distributable cash flow per share by 76% and 52%, respectively.
Holly Energy continues to see attractive growth prospects going forward.
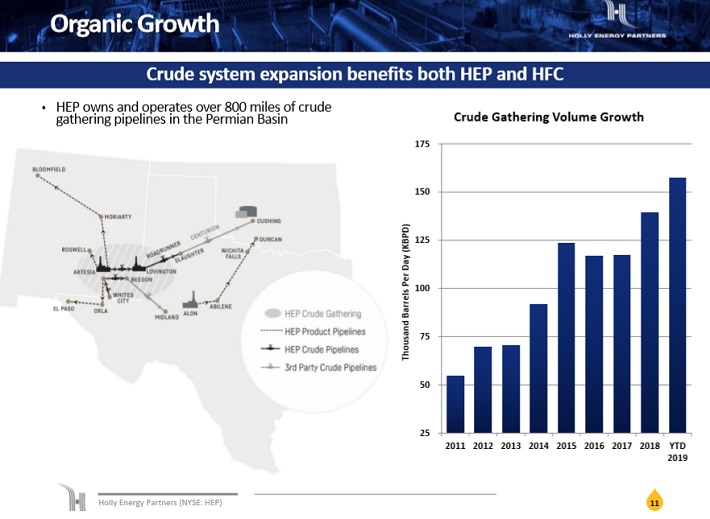
Source: Investor Presentation
In late October, HEP reported (10/30/19) financial results for the third quarter of fiscal 2019. Its adjusted earnings-per-share rose from $0.43 in last year’s quarter to $0.45 while its distributable cash flow increased 3.4%, from $66.6 million to $68.8 million. Performance was driven by higher crude oil pipeline volumes around the pipeline systems in Wyoming and Utah and strong tank volumes at El Dorado and Tulsa.
However, management stated that it will freeze the distribution at $0.6725 per quarter for the foreseeable future and expects 1.0x coverage for this and next year. The distribution technically remains covered, but investors will want to closely monitor the company’s financial results going forward.
HEP achieves growth thanks to contractual tariff escalators, which raise the fees it charges to its customers over time, and the addition of new pipelines. HEP has more than 800 miles of crude oil gathering facilities in the Permian Basin and can continue leveraging its footprint in this area for years
We expect total annual returns of 12.1%, due to the 11.6% yield as well as modest distributable cash flow growth each year.
MLP #7: NextEra Energy Partners (NEP)
- Expected 5-year Annual Returns: 13.3%
NextEra Energy Partners was formed in 2014 as Delaware Limited Partnership by NextEra Energy to own, operate, and acquire contracted clean energy projects with stable, long-term cash flows. The company’s strategy is to capitalize on the energy industry’s favorable trends in North America of clean energy projects replacing uneconomical projects.
At the end of 2018, NextEra Energy Partners operates 34 contracted renewable generation assets consisting of wind and solar projects in 12 states across the United States. The company also operates contracted natural gas pipelines in Texas, which accounted for 18% of NextEra Energy Partners income in 2018.
On July 1, 2014, NextEra Energy Partners had its initial public offering at $25 per share; it is now trading at almost double the IPO share value. Following the IPO, NextEra Energy (the largest utility company in North America) held 82.6% of NextEra Energy Partners.
On October 22nd, NextEra released third-quarter financial results. Adjusted earnings-per-share increased 10% year-over-year, reflecting strong growth at Florida Power & Light Company, Gulf Power Company and NextEra Energy Resources.
NextEra expects strong growth through the next few years.
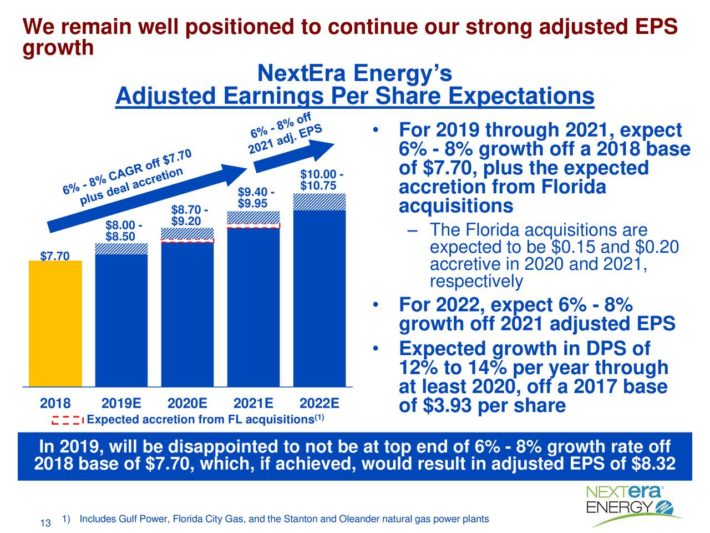
Source: Investor Presentation
NextEra expects 6%-8% adjusted EPS growth through 2022, along with double-digit dividend growth thorugh at least 2020.
NextEra’s impressive project backlog is expected to fuel its growth. Last quarter, NextEra Energy added approximately 1,375 megawatts of renewables projects to its backlog, which now totals more than 12,300 megawatts.
Overall, we expect total annual returns of 13.3% through 2024, consisting of 4% annual earnings growth, the 3.9% dividend yield, and a sizable 5.4% annual tailwind from valuation expansion.
MLP #6: Enterprise Products Partners (EPD)
- Expected 5-year Annual Returns: 14.1%
Enterprise Products Partners was founded in 1968. It is structured as a Master Limited Partnership, or MLP, and operates as an oil and gas storage and transportation company.
Enterprise Products has a tremendous asset base which consists of nearly 50,000 miles of natural gas, natural gas liquids, crude oil, and refined products pipelines. It also has storage capacity of more than 250 million barrels. These assets collect fees based on materials transported and stored.
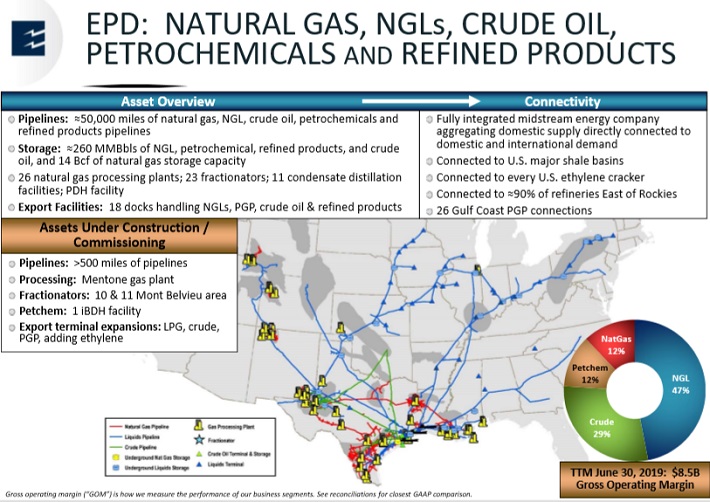
Source: Investor Presentation
On 10/28/19, Enterprise Products reported third-quarter 2019 financial results. Distributable cash flow increased 4.7% to $1.64 billion. This enabled Enterprise to achieve 1.7x distribution coverage for the third quarter, and retain significant cash flow for growth capex.
Enterprise has positive growth potential moving forward, thanks to new projects and exports. For example, Enterprise Products has started construction of the Mentone cryogenic natural gas processing plant in Texas, which will have the capacity to process 300 million cubic feet per day of natural gas and extract more than 40,000 barrels per day of natural gas liquids. The facility is expected to begin service in the first quarter of 2020.
Enterprise Products is also developing the Shin Oak NGL Pipeline, which is scheduled to be placed into service next year. The Shin Oak NGL Pipeline is expected to have total capacity of 600,000 barrels per day. Exports are also a key growth catalyst. Demand for liquefied petroleum gas and liquefied natural gas, or LPG and LNG respectively, is growing at a high rate across the world, particularly in Asia.
In terms of safety, Enterprise Products Partners is one of the strongest midstream MLPs. It has credit ratings of BBB+ from Standard & Poor’s and Baa1 from Moody’s, which are higher ratings than most MLPs.
Enterprise Products’ high-quality assets generate strong cash flow, even in recessions. As a result, Enterprise Products has been able to raise its distribution to unitholders for 61 quarters in a row.
We expect total annual returns of 14.1% through 2024, consisting of 4% annual DCF growth, the 6.7% distribution yield, and a 3.4% annual tailwind from valuation expansion.
MLP #5: MPLX LP (MPLX)
- Expected 5-year Annual Returns: 15.0%
MPLX, LP is a master limited partnership that was formed by the Marathon Petroleum Corporation (MPC) in 2012. The business operates in two segments: Logistics and Storage – which relates to crude oil and refined petroleum products – and Gathering and Processing – which relates to natural gas and natural gas liquids (NGLs). The $26 billion limited partner generated $2.7 billion in distributable cash flow in 2018.
On July 30th, 2019 MPLX completed the acquisition of Andeavor Logistics LP. On October 25th, 2019 MPLX announced a 6.3% year-over-year quarterly distribution increase to $0.6775 per unit, equating to $2.71 on an annual basis. This marks the 27th consecutive quarterly distribution increase from the company.
On October 31st, 2019 MPLX released Q3 2019 results for the period ending September 30th, 2019. For the quarter Net Income equaled $629 million, compared to $510 million previously. Distributable Cash Flow (DCF) equaled $1.027 billion (~$1.05 per unit) compared to $766 million (~$0.96 per unit) in Q3 2018.
MPLX ended the quarter with an adjusted distribution covered ratio of 1.42x and a consolidated debt to adjusted EBITDA ratio of 4.0x compared to 3.8x in Q3 2018.
MPLX has positive growth prospects, due primarily to its projects currently under development.
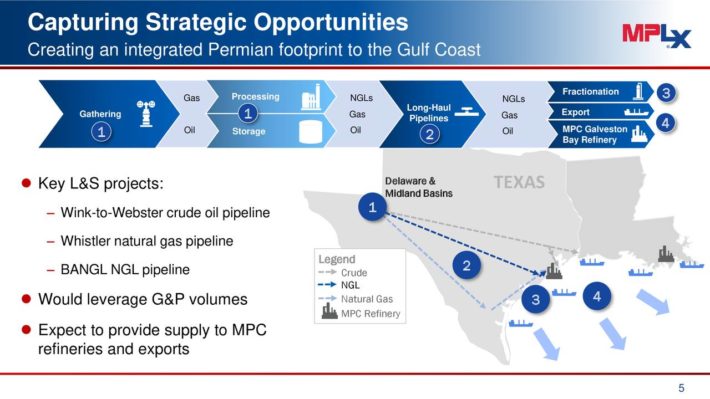
Source: Earnings Slides
Pipelines tend to have a stronghold in terms of extracting economic rents, and natural gas is cleaner than coal. In the last decade, natural gas has overtaken coal as the leading source of electricity generation in the U.S. Building pipelines requires years of approvals and ongoing regulation.
As such, pipeline firms enjoy “toll-booth” type business models, with a good portion of their revenue fixed via fee-based and “take or pay” agreements. MPLX in particular has a strong position in the Marcellus / Utica region, with long-term contracts from Marathon.
We expect total annual returns of 15.0% through 2024, consisting of 3% annual cash flow per share growth, the 10.6% dividend yield, and a modest 1.4% annual tailwind from valuation expansion.
MLP #4: Magellan Midstream Partners (MMP)
- Expected 5-year Annual Returns: 15.8%
Magellan Midstream Partners has the longest pipeline system of refined products in the U.S., which is linked to nearly half of the total U.S. refining capacity. Its network of assets includes 9,700 miles of pipeline, 53 storage terminals, and 45 million barrels of storage capacity.
Refined products generate approximately 59% of its total operating income while crude oil and marine storage represents the remaining 41%. Magellan has a market capitalization above $14 billion.
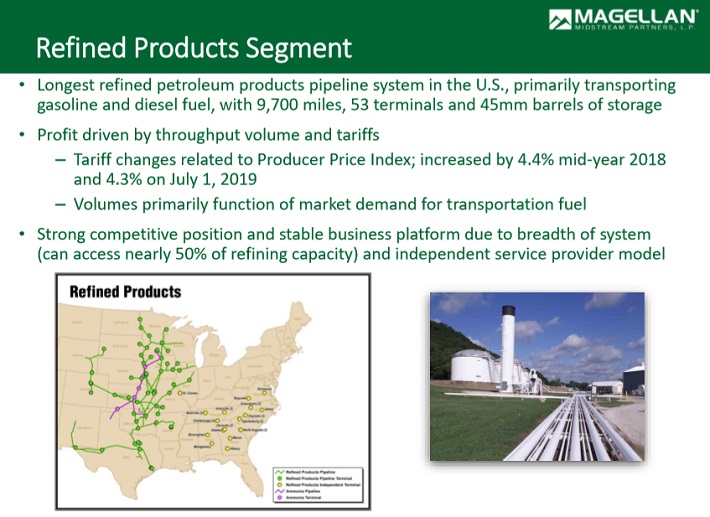
Source: Investor Presentation
In late October, Magellan reported third quarter results including operating profit growth of 12% in refined products and 1% growth in crude oil and marine storage. Adjusted earnings-per-share and distributable cash flow increased 13% and 9%, respectively, due to higher shipments of refined products and a higher average transportation rate.
Magellan’s extensive and diversified network of pipeline and storage assets is a significant competitive advantage. Another competitive advantage is its fee-based model in which the company generates fees based on volumes transported and stored and not on the underlying commodity price. This helps insulate Magellan from sharp declines in commodity prices. Only ~10% of its operating income depends on commodity prices.
Magellan has promising growth prospects in the years ahead, as it has several growth projects under way. During the last decade, the company invested $5.4 billion in growth projects and acquisitions and has exhibited much better performance than the vast majority of MLPs.
The company will invest $1.0 billion in these projects this year and $400 million in 2020. It also has more than $500 million of potential growth projects under consideration and continues to evaluate their prospects in order to identify the most promising ones. Magellan has grown its cash flow per share at a 4.5% average annual rate in the last decade, which includes the Great Recession.
Magellan has an excellent track record of steadily growing its distribution, and strong distribution safety. Magellan has increased its distribution 70 times since its initial public offering in 2001. The company expects to maintain a distribution coverage ratio of at least 1.2x over the next several years, which will be sufficient to raise the payout each year.
Magellan also has a strong debt profile, with a leverage ratio of 2.8x, and a high credit rating of BBB+ from Standard & Poor’s,
We expect total annual returns of 15.8% through 2024, consisting of 5% annual cash flow growth, the 6.8% distribution yield, and a 4% annual tailwind from valuation expansion.
MLP #3: Genesis Energy LP (GEL)
- Expected 5-year Annual Returns: 17.4%
Genesis Energy is a diversified midstream energy limited partnership, which generates ~42% of its operating income from offshore pipeline transportation, ~36% from sodium minerals and sulfur services, ~16% from onshore facilities and ~6% from marine transportation. It has a market capitalization of $2.4 billion.
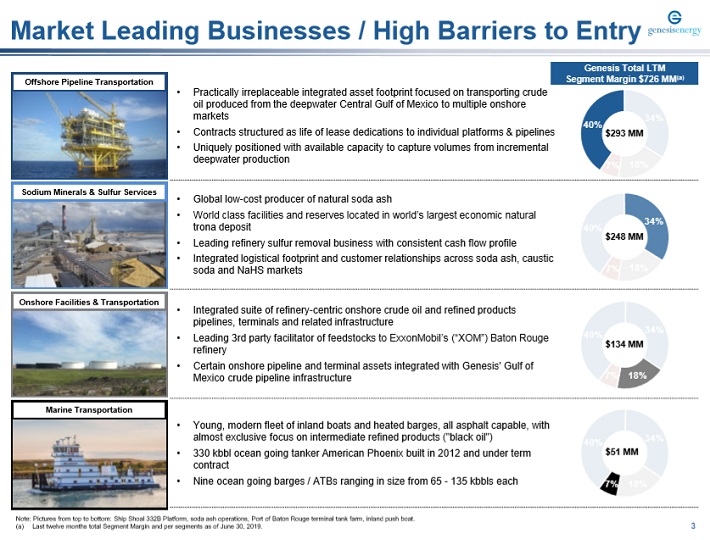
Source: Investor Presentation
In the most recent quarter, cash flows from operating activities declined 13% from the same quarter last year. The company generated cash before reserves to common unitholders of $82.5 million which represented distribution coverage of 1.22x for the quarter. Flows from Operating Activities of $136.1 million for the third quarter of 2019 compared to $156.7 million for the same period in 2018. Genesis ended the quarter with a leverage ratio of 4.91x.
While Genesis Energy operates primarily with a fee-based model, its earnings are not resilient. In our view, the MLP invested too heavily and increased its leverage too much in the past.
In response, Genesis Energy now intends to reduce its leverage ratio from 5.0x to about 4.0x in the upcoming years. Moreover, U.S. oil production has reached record levels and is expected by the Energy Information Administration to keep posting new all-time highs in the upcoming years. This oil boom will be prominent in the Gulf of Mexico, where Genesis Energy generates a great portion of its earnings thanks to the services it provides to deep-water oil producers.
We expect total annual returns of 17.4% through 2024, consisting primarily of 6% annual EBITDA-per-unit growth and the 11.1% yield, with a minor 0.3% annual tailwind from valuation expansion.
MLP #2: Energy Transfer (ET)
- Expected 5-year Annual Returns: 18.1%
Energy Transfer is a midstream oil and gas Master Limited Partnership, or MLP. Energy Transfer’s business model is storage and transportation of oil and gas. Its assets have total gathering capacity of nearly 13 million Btu/day of gas, and a transportation capacity of 22 million Btu/day of natural gas and over 4 million barrels per day of oil.
Energy Transfer’s diversified and fee-based assets provide the company with steady cash flow, even when oil and gas prices decline. As a midstream operator, Energy Transfer’s cash flow relies heavily upon volumes, and less so on commodity prices.
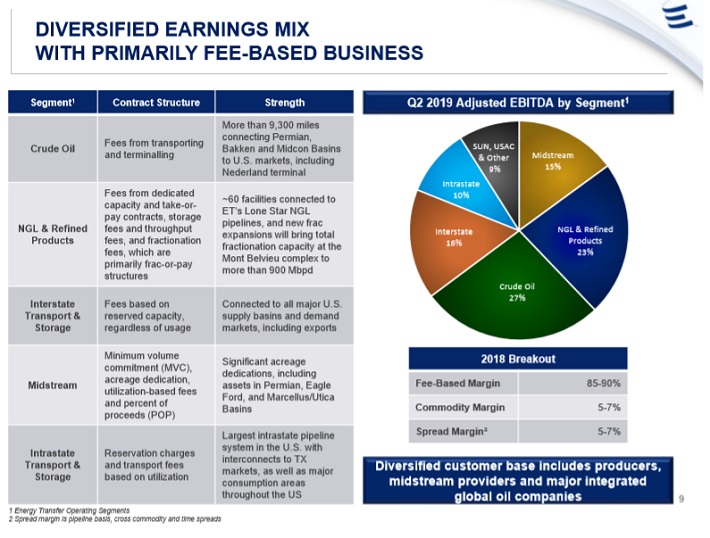
Source: Investor Presentation
ET reported 2019 second-quarter results on August 8th. In addition to distribution coverage reaching 2x for the second straight quarter, the company reported a record $2.82 billion of adjusted EBITDA and $1.6 billion of distributable cash flow to partners, backed by significant growth in four of its five core businesses, with record operating performance achieved in the natural gas liquids and refined products segment.
Looking ahead, the partnership expects to reach its leverage targets within the next few quarters and will then consider growing the distribution, as well as buying back units with its significant amount of excess distributable cash flow.
The company is also making strong progress on several growth projects which should be adding to cash flows in the coming quarters and years. For example, Energy Transfer announced it will construct a seventh natural gas liquids (NGL) fractionation facility at Mont Belvieu, Texas, with 150,000 barrels per day of capacity. Fractionator VII is scheduled to be operational in the first quarter of 2020 and is fully subscribed by multiple long-term contracts.
The company is also progressing with plans on a Bakken pipeline optimization project, which is expected to start up in 2020. And, Energy Transfer is currently expanding its Permian Express pipeline system by an additional 120,000 barrels per day. The Permian Express 4 expansion is expected to be in-service by the 2019 third quarter.
The company’s new projects will help secure its attractive distribution, which currently yields nearly 9%. Energy Transfer anticipates a distribution coverage ratio of ~1.7x to ~1.9x for 2019, which is better than average for an MLP.
We expect total annual returns of 18.1% through 2024, consisting of 3% annual DCF growth, the 10% dividend yield, and a sizable 5.1% annual tailwind from valuation expansion..
MLP #1: EQM Midstream Partners (EQM)
- Expected 5-year Annual Returns: 22.1%
EQM Midstream Partners LP is a growth-oriented limited partnership that owns and operates midstream assets in the Appalachian Basin. It is one of the largest gatherers of natural gas in the U.S. and offers midstream services to producers, utilities and other customers. It enjoys reliable cash flows thanks to its long-term contracts with its customers and trades with a market capitalization of $5.3 billion.
EQM is banking heavily on its slate of growth projects to fuel higher cash flow going forward, primarily its $4 billion project backlog.

Source: Investor Presentation
EQM Midstream has a strong pipeline of growth projects and is well positioned to remain in its solid growth trajectory. We expect this year’s distributable cash flow per unit to drop to about $5.00 (for a distribution coverage ratio of 1.08x) due to the issuance of new units for the previously mentioned simplification transaction. The Mountain Valley Pipeline project has been greatly delayed due to opposition from environmental groups and its total expected cost has risen once again, from $4.6 billion to $4.8-$5.0 billion.
Moreover, management now expects to complete the project in mid-2020 instead of Q4-2019. On the bright side, management expects to grow adjusted EBITDA by 50% in the next three years and raise the distribution at a 6% annual rate in the upcoming years. However, management has stated it will reassess the distribution once the Mountain Valley Pipeline project is finished.
We expect total annual returns of 22.1% through 2024, consisting mainly of the 17.2% distribution yield, 3.7% annual cash flow per share growth, and a modest 1.2% annual tailwind from valuation expansion.
That said, investors will want to keep an eye on the company’s distribution coverage in future quarters, as such as high yield implies some doubt as to whether the payout is sustainable. We view EQM as a high-risk, high-reward MLP that is appropriate only for investors willing to take the excess risk.
MLP ETFs, ETNs, & Mutual Funds
There are 3 primary ways to invest in MLPs:
- By investing in units of individual publicly traded MLPs
- By investing in a MLP ETF or mutual fund
- By investing in a MLP ETN
Note: ETN stands for ‘exchange traded note’
The difference between investing directly in a company (normal stock investing) versus investing in a mutual fund or ETF is very clear. It is simply investing in one security versus a group of securities.
ETNs are different. Unlike mutual funds or ETFs, ETNs don’t actually own any underlying shares or units of real businesses. Instead, ETNs are financial instruments backed by the financial institution (typically a large bank) that issued them. They perfectly track the value of an index. The disadvantage to ETNs is that they expose investors to the possibility of a total loss if the backing institution were to go bankrupt.
The advantage to investing in a MLP ETN is that distribution income is tracked, but paid via a 1099. This eliminates the tax disadvantages of MLPs (no K-1s, UBTI, etc.). This unique feature may appeal to investors who don’t want to hassle with a more complicated tax situation. The J.P. Morgan Alerian MLP ETN makes a good choice in this case.
At Sure Dividend, we prefer investing directly into individual securities (like one or more of the 10 highest ranked MLPs in this article) rather than into funds. That’s because this gives us the flexibility to invest in our best ideas and create a portfolio that matches the individual needs of each investor.
Final Thoughts
Master Limited Partnerships are a misunderstood asset class. They offer diversification, tax-advantaged and tax-deferred income, high yields, and have historically generated excellent total returns.
The asset class is likely under-appreciated because of its more complicated tax status, and because it is relatively new. The first MLP was created in 1981, so they are still a relatively new investment form.