

“With a good perspective on history, we can have a better understanding of the past and present, and thus a clear vision of the future.” --Carlos Slim Helu


NASTY MEAN REVERSION (November 24, 2021): There is a fascinating paradox in the financial markets. The most consistent pattern for asset behavior through the centuries is that assets which are dramatically below fair value will have a very high likelihood of rallying toward fair value and beyond to a nearly opposite extreme, while those assets which have become the most overpriced relative to fair value will have a powerful tendency to eventually plummet to fair value and beyond to a similarly-undervalued bottom. However, only a tiny minority of investors will structure their net worth to anticipate this process, since when assets are the most overvalued they appear to be the most superior and the most likely to continue climbing, while assets which are the most out of favor and the best bargains will appear to be hopeless and inferior and will emotionally induce selling rather than buying.
This is one of the primary reasons that we have experienced all-time record inflows into U.S. equity funds in 2021 which have surpassed the combined inflows from 2001 through 2020, while in years with the best opportunities there have been the heaviest net outflows. Investors keep psychologically projecting the past couple of years into the indefinite future.
People tend to be heavily influenced by the moods of their era, often subconsciously.
Andrew Tobias wrote a worthwhile book in 1980 entitled Getting By on 100,000 a Year (and Other Sad Tales). In the early 1980s hardly anyone wanted to invest in real estate, bonds, stocks, and most related assets, because the media were telling them every day why both interest rates and inflation would remain persistently high for decades or permanently. In that environment the most-popular investments were money-market funds which sometimes paid as much as 20% annualized. It was emotionally challenging to realize that if everyone else was shunning many kinds of asset classes then that made them ideal for purchase. Only a few assets in 1980 like precious metals were popular and wildly overpriced.
Today we have nearly the opposite situation in which recent participants are so confident that they are far more concerned about missing out on gains than they are about the risk of losing money. Meanwhile, precious metals which had been so overpriced in early 1980 have become undervalued along with some emerging-market stocks and bonds.
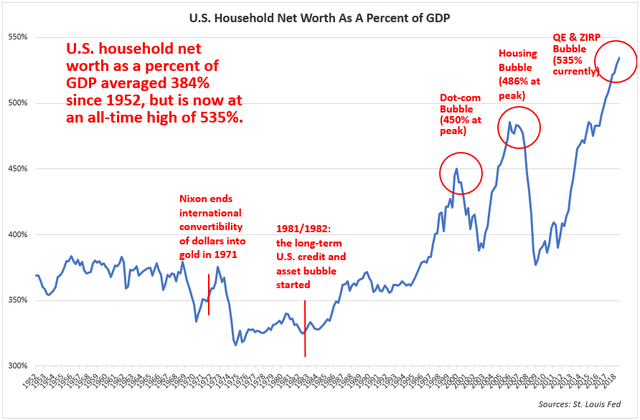
There are many ways to gauge under- and overvaluation including the ratio of total stock market capitalization to GDP for any country.
While emerging markets including Brazil, Turkey, and Chile are experiencing unusually low ratios of both household net worth and total market capitalization to gross domestic product, the U.S. has never been higher even at previous bubble peaks:
The Boglehead argument is most convincing when it should be most ignored and vice versa.
Almost no one wanted to gradually buy and hold in the early 1980s. Here's why: if you had invested in the equivalent of the S&P 500 Index in August 1929 then by August 1982--53 years later--you would have lost 38% of your money after adjusting for inflation as this chart demonstrates:
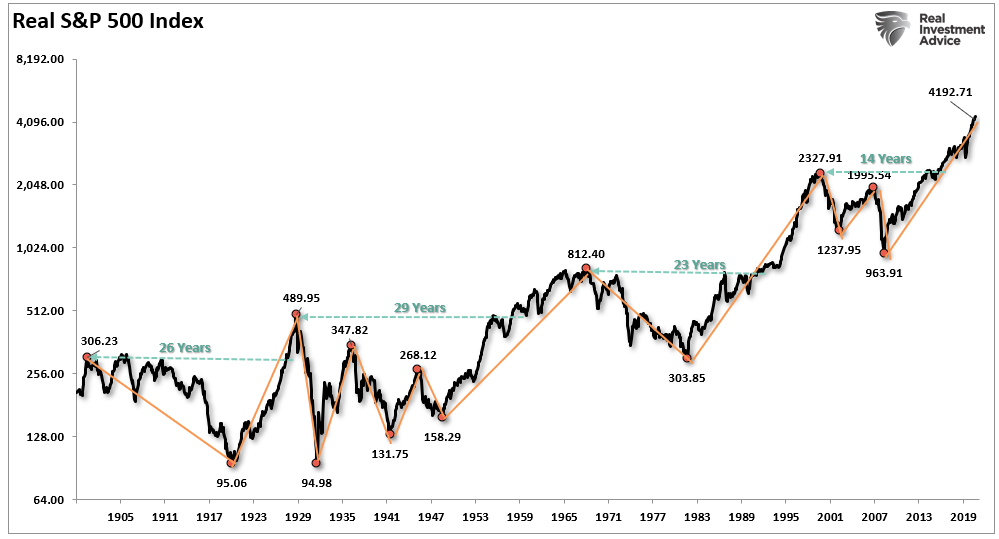
Ironically that would have made it extremely worthwhile to keep steadily buying stocks into all pullbacks in the early 1980s and at all subsequent higher bottoms. Today, when there is the greatest risk of a similar substantial loss over the next half century or so, being a Boglehead has never been more popular.
If everyone wants to "buy and hold" anything then you must do neither.
It is no coincidence that we simultaneously have very-overpriced assets at the same time as we have supply-chain problems, a shortage of workers, rising inflation, and other rare behavioral extremes.
People involved with real estate in Boise will tell you that Californians are piling in and causing permanently higher prices, while those in California will tell you that people from some other part of the world are causing housing prices to be unaffordable in their towns. Hardly anyone puts two and two together to conclude that nearly all of the peculiar distortions in the global economy are interconnected.
Imagine an inverted world in which we have a multi-decade record inventory of real estate and prices at multi-decade lows in inflation-adjusted terms. Also try to imagine dramatic losses for today's most-popular assets, multi-decade highs in unemployment in most parts of the world, and almost no one wanting to talk about cryptocurrencies because they have collapsed in value. While that might seem like an impossible scenario it is by far the most likely conclusion to the most-overpriced assets reverting to the mean and beyond to some kind of opposite extremes. This is not a far-future science-fiction scenario but something which could occur within three years and perhaps sooner.
While investors keep piling into mega-cap U.S. tech shares they have shunned Chinese internet companies, telecommunications shares, and several other sectors.
In the final weeks of 2020 and the early weeks of 2021 nearly all assets worldwide were moving higher in tandem. Since then we have been experiencing widening disparities between asset classes worldwide. The more that undervalued assets retreat in price, such as UGP, TUR, T, ITUB, and some other assets which I have been gradually accumulating recently, the more that investors are shunning these because most investors conclude that something in a lengthy downtrend will keep dropping. On the opposite overpriced end of the spectrum, analysts are focusing too much on profit growth by itself and too little on the connection between the profits of a company and its stock price.
The next few years will likely experience more frequent and more intense corrections than the average three-year period.
Periods of recent extraordinary overvaluation and extended outperformance tend to be followed by above-average pullbacks. You should therefore keep more in cash than usual in order to be able to take advantage of upcoming bargains. The more severe any overall decline tends to be, the more likely that some assets--often unknown in advance--will become especially oversold and undervalued and will thereafter rebound aggressively.
Be sure to take advantage of the U.S.-guaranteed interest rate of 7.12%.
Did you know that I Bonds, issued by the U.S. government, are currently guaranteed to pay 7.12% for six months with zero state and local income tax due on the interest (and sometimes no federal tax if the money is used for education)? Some people believe that you can only put 10 thousand dollars per calendar year into I Bonds, but that is per account, not per person. A married couple can contribute 65 thousand dollars per calendar year into I Bonds as follows: 1) 10K in your name; 2) 10K in your spouse's name; 3) 10K in the name of your revocable living trust which can be a single paragraph putting your shoelaces into it; 4) 10K into your spouse's revocable living trust; 5) 10K in your business name; 6) 10K in your spouse's business name; 7) 5K by intentionally overpaying your January 15, 2022 federal estimated tax by several thousand dollars and putting five thousand of your federal tax refund into I Bonds.
I may discuss I Bonds in more detail in my next post. Be sure to do your maximum total as soon as possible for 2021 since you have only about one month left. In early 2022 you can do your allocation for next year.
The bottom line: most investors are currently betting on some all-time record extremes becoming even more extreme. While this is always possible and may be more likely in the short run, eventually all assets regress to the mean and beyond to a roughly opposite extreme. It is therefore worth considering going against the herd. The most-overpriced assets today tend to be the most popular including large-cap U.S. tech, crypto, ESG, high-yield corporate bonds, and real estate, while many emerging-market and precious-metals shares are near multi-decade lows in either relative or absolute terms.
This mean regression could become nasty, probably involving much bigger percentage changes and greater volatility in both directions than most investors are anticipating.
Disclosure of current holdings (most recent purchases in red):
Here is my asset allocation with average opening prices adjusted for all dividends: 45.3% cash including I Bonds paying 7.12% guaranteed, TIAA Traditional Annuity paying 3% to 5% (only available for legacy retirement accounts), and Discover Bank high-yield savings paying 0.40% (available for all U.S. residents with retirement and ordinary savings accounts); 19.2% short XLK (112.7737); 17.8% short QQQ (309.7504); 17.2% long TLT (148.259); 8.25% short TSLA (494.9721); 6.3% long GEO (7.65); 4.55% long GDXJ (41.6112); 1.65% long GDX (30.1982); 0.85% short AAPL (125.5481); 0.7% long ASA (19.35); 0.7% long UGP (2.565); 0.55% short IWF (223.0119); 0.45% short SMH (170.7813); 0.2% long ECH (24.23); 0.2% long TUR (19.5525); 0.0375% long ITUB (3.94); 0.025% long BBD (3.44); 0.0125% long TIMB (9.99); 0.0125% long T (23.99). It doesn't add up to 100% since short positions require less cash; there is no margin involved.
I closed out my ZM short position on November 23, 2021 at 199.99 with an average short-sale price of 293.16.
You may wish to check out the following article on MarketWatch.com:
Steven Jon Kaplan runs True Contrarian where this article appeared first.
Source truecontrarian-sjk