Updated on October 31st, 2019 by Aristofanis Papadatos
Alibaba (BABA) has strongly rewarded its shareholders since its IPO, in 2014. Since then, the stock of the Chinese e-commerce giant has rallied 96% whereas the S&P 500 Index has advanced only 54%. It has generated these returns for shareholders purely with a rising share price, unlike many other technology stocks which provide returns through dividends.
We’ve compiled a list of all ~330 dividend-paying technology stocks complete with important investing metrics, which you can access below:
You can view a preview of our technology stocks spreadsheet below:
Ticker Name Price Dividend Yield Market Cap ($M) P/E Ratio Payout Ratio
AACAF
AAC Technologies Holdings, Inc.
6.15
23.3
7,432.3
18.4
427.5
AACAY
AAC Technologies Holdings, Inc.
6.41
2.9
7,529.0
19.2
56.3
AAPL
Apple, Inc.
243.26
1.2
1,099,335.7
20.6
25.4
ABT.TO
Absolute Software Corporation
7.75
4.1
324.9
43.1
177.8
ACKAY
Arçelik AS
16.20
0.0
2,189.4
12.6
0.0
ACN
Accenture Plc
186.58
1.2
118,877.8
24.9
30.2
ADI
Analog Devices, Inc.
108.25
1.9
39,988.2
26.5
51.3
ADTN
ADTRAN, Inc.
9.58
2.8
458.2
117.1
330.1
ADTTF
Advantest Corp.
26.75
157.0
5,294.6
10.8
1,693.4
AELTF
Adacel Technologies Ltd.
0.30
0.0
25.2
-12.1
0.0
AEXAY
ATOS SE
15.34
2.5
8,371.1
11.2
27.7
ALMFF
Altium Ltd.
22.04
1.1
2,886.5
54.3
59.9
ALOT
AstroNova, Inc.
15.70
1.8
110.7
17.1
30.6
ALSWF
Absolute Software Corp.
5.89
6.8
245.7
31.8
216.1
ALTKY
Altran Technologies SA
1.50
1.8
3,818.4
31.9
57.7
AMADF
Amadeus IT Group SA
74.70
1.6
32,193.0
27.2
42.8
AMADY
Amadeus IT Group SA
73.84
1.8
31,809.4
26.9
48.4
AMAT
Applied Materials, Inc.
55.21
1.9
51,000.5
18.2
33.9
AMOT
Allied Motion Technologies, Inc.
38.60
0.3
370.6
22.0
6.8
AMSWA
American Software, Inc.
16.31
3.4
511.6
77.2
260.2
APELY
Alps Alpine Co., Ltd.
40.56
0.0
4,180.4
25.5
0.0
APH
Amphenol Corp.
100.82
0.9
29,892.3
25.6
23.8
ARLUF
Aristocrat Leisure Ltd.
22.35
1.6
14,242.6
31.0
49.6
ASMIY
ASM International NV
102.96
1.0
4,760.5
17.8
18.6
ASML
ASML Holding NV
265.65
0.9
111,876.7
44.2
39.0
ASMLF
ASML Holding NV
262.15
1.2
110,402.7
43.6
52.4
ASMVF
ASM Pacific Technology Ltd.
14.05
19.2
5,708.3
45.0
865.7
ASMVY
ASM Pacific Technology Ltd.
42.26
2.4
5,723.2
45.2
110.4
ASOZF
Asseco Poland SA
12.68
24.2
1,052.4
11.8
285.8
ASOZY
Asseco Poland SA
11.65
6.9
967.0
10.8
75.2
ASX
ASE Technology Holding Co., Ltd.
5.10
3.2
10,669.6
20.3
64.5
ATDRY
Auto Trader Group Plc
1.78
1.2
6,578.3
25.9
30.5
ATEYY
Advantest Corp.
45.83
0.0
10,035.1
17.8
0.0
ATVI
Activision Blizzard, Inc.
55.87
0.7
42,853.7
25.3
16.8
AUKUF
ams AG
46.05
0.0
3,722.5
44.1
0.0
AVEVF
AVEVA Group Plc
54.30
0.8
8,750.3
200.9
159.1
AVGO
Broadcom, Inc.
290.24
3.7
115,129.8
-72.4
-264.3
AVT
Avnet, Inc.
39.60
2.0
3,998.1
31.7
64.9
AVX
AVX Corp.
15.40
3.7
2,604.0
11.2
41.9
AYI
Acuity Brands, Inc.
128.63
0.4
5,132.2
15.5
6.2
BBOX
Black Box Corporation
0.00
0.0
0.0
BCNAF
Barco NV
216.50
1.1
2,700.0
26.1
27.7
BDC
Belden, Inc.
51.13
0.4
2,324.0
12.6
4.9
BELFA
Bel Fuse, Inc.
13.09
1.8
161.2
9.2
16.8
BELFB
Bel Fuse, Inc.
15.18
1.8
187.0
9.3
17.1
BKTI
BK Technologies Corp.
3.61
1.7
45.9
-20.5
-34.0
BLKB
Blackbaud, Inc.
86.25
0.7
4,280.5
205.8
141.9
BMI
Badger Meter, Inc.
58.63
1.1
1,706.8
36.9
39.0
BRKS
Brooks Automation, Inc.
43.02
0.9
3,133.8
86.7
79.9
BVILF
Breville Group Ltd.
11.50
2.3
1,499.4
30.9
71.2
BVILY
Breville Group Ltd.
18.05
2.8
1,176.7
24.3
68.9
BYDIF
BYD Electronic (International) Co., Ltd.
1.66
13.4
3,740.3
15.7
209.7
CA
CA, Inc.
0.00
0.0
0.0
CBLNY
Mersen SA
6.42
3.3
661.6
9.4
31.4
CCMP
Cabot Microelectronics Corp.
151.69
1.1
4,453.3
38.2
41.4
CCOEF
Capcom Co., Ltd.
25.75
213.6
2,748.8
19.4
4,152.5
CCUR
CCUR Holdings, Inc.
3.60
0.0
32.1
44.3
0.0
CDK
CDK Global, Inc.
50.09
1.2
6,081.2
53.9
64.6
CDW
CDW Corp.
131.65
0.9
18,433.8
28.2
26.1
CGEMY
Capgemini SE
22.55
1.7
18,925.8
20.4
34.6
CGNX
Cognex Corp.
51.97
0.5
8,869.3
52.7
25.8
CIOXF
Cielo SA
8.77
9.4
23,797.9
36.8
344.5
CIOXY
Cielo SA
1.84
9.6
5,047.2
7.7
74.5
CLRO
ClearOne, Inc.
1.52
0.0
25.3
-0.9
0.0
CMG.TO
Computer Modelling Group Ltd.
6.94
5.7
572.9
23.1
131.4
CMI.V
C-Com Satellite Systems Inc.
1.63
3.1
61.7
41.8
130.8
CMPVF
CompuGroup Medical SE
78.15
0.6
3,845.4
41.2
26.4
CMSQF
Computershare Ltd.
10.85
2.9
5,873.9
14.2
41.1
CMTL
Comtech Telecommunications Corp.
34.58
1.2
839.2
33.3
38.6
CNSWF
Constellation Software, Inc.
1,004.19
5.6
21,088.2
52.6
296.0
COHU
Cohu, Inc.
16.47
1.5
676.9
-7.3
-10.6
CPSI
Computer Programs & Systems, Inc.
23.41
1.7
336.1
17.9
30.6
CRWRY
0.00
0.0
0.0
CSCO
Cisco Systems, Inc.
47.56
2.9
201,836.6
18.1
52.5
CSGS
CSG Systems International, Inc.
52.22
1.7
1,723.7
22.3
37.4
CSIOF
Casio Computer Co., Ltd.
1.00
2,500.0
243.3
1.2
3,077.7
CSPI
CSP, Inc.
13.16
4.6
54.7
-40.1
-182.6
CSSXF
China Singyes Solar Technologies Holdings Ltd.
0.10
0.0
83.4
-0.4
0.0
CSU.TO
Constellation Software Inc.
1,281.98
0.4
27,738.0
67.2
28.2
CSVI
Computer Services, Inc.
44.76
2.9
1,244.0
26.2
77.0
CSXXY
carsales.com Ltd.
20.88
3.0
2,559.3
42.2
127.6
CSYJF
CSE Global Ltd.
0.33
8.3
167.4
11.3
94.2
CSYJY
CSE Global Ltd.
3.37
5.9
171.2
11.5
68.4
CTS
CTS Corp.
27.63
0.6
900.8
20.8
12.0
CY
Cypress Semiconductor Corp.
23.29
1.9
8,601.3
29.4
55.5
DAKT
Daktronics, Inc.
7.15
3.4
321.4
206.1
691.6
DASTF
Dassault Systèmes SA
151.25
0.4
39,144.0
55.7
23.9
DASTY
Dassault Systèmes SA
151.49
0.5
39,431.3
57.5
27.6
DBD
Diebold Nixdorf, Inc.
6.92
0.0
531.1
-1.5
0.0
DCHIY
Digital China Holdings Ltd.
2.68
1.5
895.6
570.2
840.4
DNACF
DeNA Co., Ltd.
16.87
237.1
2,453.0
27.2
6,458.9
DOX
Amdocs Ltd.
65.25
1.7
8,940.1
22.5
37.7
DXC
DXC Technology Co.
27.69
3.6
7,253.7
6.5
23.8
EBIX
Ebix, Inc.
43.40
0.7
1,323.2
14.5
10.0
EGHSF
Enghouse Systems Ltd.
28.04
2.1
1,534.2
30.8
65.9
ELUXF
Electrolux AB
24.00
35.4
6,897.5
18.2
643.7
ELUXY
Electrolux AB
52.67
3.4
7,493.9
17.5
59.4
ENGH.TO
Enghouse Systems Limited
37.93
1.2
2,076.0
31.6
36.7
ENR
Energizer Holdings, Inc.
43.35
2.8
2,986.9
373.7
1,034.5
ENS
EnerSys
67.90
1.0
2,884.5
17.7
18.2
ERIC
Telefonaktiebolaget LM Ericsson
8.75
1.2
26,725.1
1,944.4
2,392.3
ERIXF
Telefonaktiebolaget LM Ericsson
8.69
0.0
28,755.9
-30.5
0.0
ESE
ESCO Technologies, Inc.
83.18
0.4
2,161.1
25.5
9.8
ESP
Espey Manufacturing & Electronics Corp.
22.50
4.4
54.0
22.9
101.6
ET.TO
Evertz Technologies Limited
17.99
4.0
1,378.0
18.7
75.7
EUTLF
Eutelsat Communications SA
19.69
12.9
4,576.9
11.8
152.2
EVSBY
EVS Broadcast Equipment S.A.
0.00
0.0
0.0
EVTC
EVERTEC, Inc.
31.88
0.8
2,321.9
23.8
18.5
EVTZF
Evertz Technologies Ltd.
12.03
13.5
924.3
16.5
222.6
FDGRY
0.00
0.0
0.0
FDRVF
First Derivatives Plc
28.90
0.9
771.3
43.2
40.3
FELTF
Fuji Electric Co., Ltd.
39.80
100.5
5,685.2
16.8
1,689.5
FICO
Fair Isaac Corp.
302.24
0.0
8,733.8
46.6
0.0
FJTSF
Fujitsu Ltd.
85.40
281.0
17,309.4
21.3
5,999.7
FLIR
FLIR Systems, Inc.
55.01
1.2
7,459.7
26.9
32.8
FORTY
Formula Systems (1985) Ltd.
67.50
1.3
1,032.4
27.6
35.2
FSOYF
F-Secure Oyj
3.18
0.0
501.8
138.9
0.0
FTV
Fortive Corp.
69.42
0.4
23,311.5
9.0
3.6
FUWAF
Furukawa Electric Co., Ltd.
27.60
5.6
1,963.0
FUWAY
Furukawa Electric Co., Ltd.
14.06
0.0
1,982.1
7.9
0.0
GLW
Corning, Inc.
30.39
3.2
23,730.5
21.2
68.2
GREZF
GREE, Inc.
4.10
243.9
943.9
43.8
10,672.4
GRMN
Garmin Ltd.
96.35
3.5
18,316.3
24.6
85.4
GSB
GlobalSCAPE, Inc.
9.78
5.4
169.8
GTOFF
Gemalto Holding BV
56.40
0.0
5,116.6
72.0
0.0
GTOMY
Gemalto Holding BV
28.11
0.0
5,100.2
71.8
0.0
GYUAF
GS Yuasa Corp.
20.55
413.6
1,667.3
13.9
5,735.5
HIMX
Himax Technologies, Inc.
2.36
0.0
411.4
214.1
0.0
HNHPF
Hon Hai Precision Industry Co., Ltd.
5.22
4.9
72,357.1
9.0
43.7
HOCPF
HOYA Corp.
84.50
53.3
31,858.1
27.7
1,474.6
HPE
Hewlett-Packard Enterprise Co.
16.31
3.5
21,294.3
-157.3
-549.7
HPHTF
Hamamatsu Photonics KK
39.45
101.4
6,106.8
32.7
3,317.3
HPQ
HP, Inc.
17.62
3.6
26,111.3
6.4
23.4
HPS.A.TO
Hammond Power Solutions Inc.
7.87
3.5
92.6
-11.9
-42.2
HRELF
Haier Electronics Group Co., Ltd.
2.85
13.3
7,973.9
13.8
184.6
HRS
Harris Corp.
189.13
1.4
22,341.2
24.9
34.6
HTHIF
Hitachi Ltd.
38.99
128.2
37,674.5
18.6
2,379.9
HTHIY
Hitachi Ltd.
76.73
0.0
7,414.1
3.4
0.0
HURC
Hurco Cos., Inc.
34.82
1.3
235.6
10.0
13.5
HXGBF
Hexagon AB
49.42
1.2
18,080.4
22.1
26.4
HXGBY
Hexagon AB
51.45
1.3
18,208.8
23.0
29.5
IBIDF
IBIDEN Co., Ltd.
19.70
279.2
2,752.8
83.3
23,265.7
IBM
International Business Machines Corp.
135.25
5.9
119,814.6
15.6
92.4
IFNNF
Infineon Technologies AG
19.79
1.4
24,781.6
23.2
31.5
IFNNY
Infineon Technologies AG
19.40
1.5
24,781.6
22.7
35.0
IIJI
0.00
0.0
0.0
INFY
Infosys Ltd.
9.57
3.4
40,029.8
18.8
64.4
INTC
Intel Corp.
56.60
2.8
246,210.0
13.1
36.1
INTU
Intuit, Inc.
260.29
0.7
67,694.7
43.4
32.4
ISDR
Issuer Direct Corp.
10.52
0.5
40.6
70.7
33.6
ITRN
Ituran Location & Control Ltd.
24.77
3.8
519.4
9.2
34.9
ITTOF
ITOCHU Techno-Solutions Corp.
23.20
349.1
5,359.9
23.2
8,108.1
JBL
Jabil, Inc.
37.51
1.1
5,726.1
20.5
21.9
JCOM
j2 Global, Inc.
95.26
1.4
4,659.8
31.6
44.3
JCS
Communications Systems, Inc.
4.60
1.7
42.9
62.6
108.8
JEHLY
Johnson Electric Holdings Ltd.
17.71
3.7
1,569.2
5.5
20.0
JELCF
Johnson Electric Holdings Ltd.
1.86
27.4
1,648.1
5.7
157.1
JNPR
Juniper Networks, Inc.
24.93
3.8
8,621.2
23.3
87.9
KACPF
0.00
0.0
0.0
KDCXF
Kudelski SA
9.47
0.0
518.3
-46.4
0.0
KLAC
KLA Corp.
172.96
1.7
27,407.8
22.9
39.7
KNAMF
Konami Holdings Corp.
41.86
338.0
5,660.8
19.0
6,410.8
KNMCY
Konami Holdings Corp.
44.07
0.0
5,959.7
20.0
0.0
KSFTF
Kingsoft Corp. Ltd.
2.27
0.0
3,099.8
-16.1
0.0
KYCCF
KEYENCE Corp.
646.00
48.7
74,698.7
40.1
1,953.9
KYOCF
Kyocera Corp.
62.00
129.0
22,428.7
26.7
3,443.4
KYOCY
Kyocera Corp.
65.50
0.0
23,495.9
28.2
0.0
LARRF
Laird PLC
0.00
0.0
0.0
LDOS
Leidos Holdings, Inc.
86.69
1.9
12,466.7
18.7
35.3
LFUS
Littelfuse, Inc.
174.27
1.3
4,285.0
26.0
33.6
LNVGF
Lenovo Group Ltd.
0.72
38.3
8,728.8
12.5
478.3
LNVGY
Lenovo Group Ltd.
13.90
5.0
8,614.6
12.2
60.3
LOGI
Logitech International SA
40.86
1.8
6,909.8
24.8
43.8
LPL
LG Display Co., Ltd.
5.84
0.0
4,186.4
-10.7
0.0
LRCX
Lam Research Corp.
277.56
1.6
40,210.4
19.6
31.4
LYTS
LSI Industries, Inc.
5.06
4.0
132.7
-8.1
-31.9
MANT
ManTech International Corp.
84.58
1.5
2,821.8
38.5
57.8
MAXR
Maxar Technologies, Inc.
7.64
0.5
456.0
-0.4
-0.2
MAXR.TO
Maxar Technologies Inc.
10.08
0.5
596.0
-0.5
-0.3
MCFUF
Micro Focus International Plc
13.07
7.0
4,356.5
-12.3
-86.1
MCHP
Microchip Technology, Inc.
95.40
1.5
22,709.4
60.8
93.1
MCRNF
Micro-Mechanics (Holdings) Ltd.
1.00
16.0
139.0
16.2
259.7
MDF.TO
Mediagrif Interactive Technologies Inc.
6.96
5.8
104.1
-3.8
-22.1
MEI
Methode Electronics, Inc.
34.40
1.3
1,275.9
13.4
17.1
MGIC
Magic Software Enterprises Ltd.
9.44
3.2
461.5
23.3
75.6
MIELF
Mitsubishi Electric Corp.
13.88
288.2
29,774.1
14.9
4,296.5
MIXIF
mixi, Inc.
19.47
873.1
1,467.1
8.0
6,985.2
MIXT
MiX Telematics Ltd.
12.45
1.8
295.5
15.6
28.9
MKSI
MKS Instruments, Inc.
110.15
0.9
6,001.5
35.4
32.2
MLAB
Mesa Laboratories, Inc.
229.71
0.3
1,001.1
113.6
39.6
MNBEF
Minebea Mitsumi, Inc.
18.50
75.7
7,679.9
16.7
1,267.5
MNBEY
Minebea Mitsumi, Inc.
37.51
0.0
7,785.8
17.0
0.0
MNDO
MIND C.T.I. Ltd.
2.35
11.1
46.6
8.6
94.6
MPWR
Monolithic Power Systems, Inc.
151.68
1.0
6,588.2
62.5
61.9
MRAAF
Murata Manufacturing Co. Ltd.
53.66
436.1
34,330.0
17.8
7,754.8
MRVL
Marvell Technology Group Ltd.
24.31
1.0
16,274.8
-38.1
-37.5
MSFT
Microsoft Corp.
144.61
1.6
1,103,202.2
27.0
43.8
MSI
Motorola Solutions, Inc.
165.36
1.4
27,541.7
26.3
36.3
MTHRF
M3, Inc.
23.15
30.2
15,705.5
80.8
2,444.1
MTSC
MTS Systems Corp.
57.81
2.1
1,117.7
22.7
47.1
MXIM
Maxim Integrated Products, Inc.
58.87
4.0
15,959.4
20.9
82.9
NATI
National Instruments Corp.
41.88
2.3
5,523.3
34.5
80.8
NEXOF
NEXON Co., Ltd.
11.50
0.0
10,356.9
11.2
0.0
NICE
NICE Ltd. (Israel)
157.98
0.0
9,873.1
54.4
0.0
NOK
Nokia Oyj
3.65
3.1
20,452.0
-34.3
-105.4
NOKBF
Nokia Oyj
3.70
5.5
20,508.0
-50.3
-274.7
NPEGF
Nippon Electric Glass Co., Ltd.
25.72
622.1
2,485.0
NPSNY
Naspers Ltd.
28.26
0.3
61,831.7
4.4
1.5
NTAP
NetApp, Inc.
56.37
3.1
13,411.2
14.2
44.3
NTDOF
Nintendo Co., Ltd.
351.00
182.3
41,812.7
26.2
4,773.9
NTDOY
Nintendo Co., Ltd.
45.79
0.0
41,989.0
27.3
0.0
NTES
NetEase, Inc.
286.14
0.9
36,614.7
28.6
26.6
NTP
Nam Tai Property, Inc.
9.12
0.0
346.8
-19.7
0.0
NVDA
NVIDIA Corp.
203.00
0.3
123,627.0
45.1
14.2
NVEC
NVE Corp.
62.94
6.4
305.0
22.2
141.4
NXCLF
Lifull Co., Ltd.
5.86
0.9
786.2
31.2
28.7
OMRNY
OMRON Corp.
58.28
0.0
12,155.3
27.8
0.0
OPESY
0.00
0.0
0.0
ORCL
Oracle Corp.
54.85
1.7
180,046.2
17.4
28.8
OSAGF
OSRAM Licht AG
43.84
2.5
4,231.4
-17.3
-43.9
OTEX
Open Text Corp.
40.27
3.8
10,897.7
37.9
143.2
OTEX.TO
Open Text Corporation
52.64
1.8
14,447.0
49.7
86.9
OXINF
Oxford Instruments Plc
16.20
0.9
927.0
24.7
22.0
PCRFF
Panasonic Corp.
8.28
362.3
19,314.4
7.7
2,806.6
PCRFY
Panasonic Corp.
8.53
0.0
19,757.6
8.0
0.0
PCTI
PCTEL, Inc.
7.37
0.7
136.3
-12.5
-9.3
PEGA
Pegasystems, Inc.
75.77
0.2
5,991.9
-114.4
-18.1
PKE
Park Aerospace Corp.
17.61
26.4
361.3
35.9
948.2
PLPC
Preformed Line Products Co.
56.90
1.4
286.2
11.9
16.7
PLT
Plantronics, Inc.
39.93
1.5
1,560.1
-8.0
-12.2
PMCUF
Pro Medicus Ltd.
18.94
0.3
2,000.6
143.4
42.6
POWI
Power Integrations, Inc.
91.89
0.9
2,703.6
46.4
43.4
PRYMF
Prysmian SpA
22.30
1.9
5,867.3
21.1
40.7
PRYMY
Prysmian SpA
11.57
4.2
6,088.3
21.9
91.7
PTFRY
PT Tower Bersama Infrastructure Tbk
22.39
2.2
1,950.7
41.8
91.2
PTG.TO
Pivot Technology Solutions, Inc.
1.46
11.0
57.6
-13.3
-146.4
PXGYF
PAX Global Technology Ltd.
0.37
21.6
407.1
5.4
117.1
QADA
QAD, Inc.
46.44
0.6
944.9
-60.7
-37.7
QADB
QAD, Inc.
36.00
0.7
732.5
-58.9
-39.3
QCOM
QUALCOMM, Inc.
81.44
3.8
99,003.4
28.6
108.8
QTRH
Quarterhill, Inc.
1.28
3.9
152.1
-4.5
-17.7
QTRH.TO
Quarterhill Inc.
1.70
2.9
200.8
-6.0
-17.5
RELL
Richardson Electronics Ltd.
5.75
5.2
75.5
-9.7
-50.7
RFIL
RF Industries Ltd.
5.97
1.3
56.1
17.4
23.4
RHDGF
Retail Holdings NV
2.35
383.0
12.1
-0.6
-211.6
RNSHF
Renishaw Plc
49.00
1.2
3,566.6
29.9
36.6
RPGRF
REA Group Ltd.
45.00
1.9
5,927.2
79.9
149.7
RSTAY
RIB Software SE
51.45
0.8
1,256.7
58.9
45.9
RTMVF
Rightmove Plc
6.59
1.0
5,791.8
26.9
27.8
RTMVY
Rightmove Plc
15.49
1.1
6,834.8
31.7
34.7
SABR
Sabre Corp.
23.32
2.5
6,031.8
26.5
67.3
SAIC
Science Applications International Corp.
82.86
1.7
4,885.4
29.2
50.3
SAP
SAP SE
132.63
1.3
159,023.3
41.5
52.2
SAPGF
SAP SE
132.77
1.1
158,474.3
41.5
46.9
SCND
Scientific Industries, Inc.
9.00
0.6
13.4
20.8
11.6
SEKEF
Seiko Epson Corp.
13.94
667.1
4,860.1
11.8
7,900.8
SEPJF
Spectris Plc
30.90
2.0
3,582.4
57.9
117.0
SEPJY
Spectris Plc
16.32
2.4
3,784.1
61.2
146.1
SGAMF
Sega Sammy Holdings, Inc.
14.08
426.1
3,305.1
88.8
37,831.0
SGPYY
The Sage Group Plc
37.94
2.3
10,248.0
25.0
57.5
SILC
Silicom Ltd.
32.74
0.0
256.0
12.7
0.0
SIMO
Silicon Motion Technology Corp.
42.29
6.0
1,584.3
19.1
114.8
SKLTF
SEEK Ltd.
12.57
2.6
4,408.7
34.2
89.5
SKSJF
Shinko Shoji Co., Ltd.
7.83
906.8
293.6
26.0
23,595.9
SLP
Simulations Plus, Inc.
34.78
0.9
609.7
77.3
66.7
SMTGF
SMA Solar Technology AG
32.80
0.0
1,138.2
-5.0
0.0
SMTOF
Sumitomo Electric Industries Ltd.
12.96
555.6
10,107.4
10.9
6,065.7
SNE
Sony Corp.
60.76
0.3
76,156.4
10.2
3.1
SNEJF
Sony Corp.
61.80
64.7
77,066.7
10.4
671.1
SNPTF
Sunny Optical Technology (Group) Co., Ltd.
15.89
4.4
16,397.9
43.3
191.7
SPHHF
Sophos Group Plc
7.45
0.6
3,639.8
131.9
74.0
SQNXF
Square Enix Holdings Co., Ltd.
47.00
169.0
5,642.1
37.0
6,251.8
SRMC
Sierra Monitor Corp.
3.24
0.6
33.2
206.4
127.4
SSNC
SS&C Technologies Holdings, Inc.
51.92
0.7
13,213.3
40.7
29.7
STM
STMicroelectronics NV
22.55
1.6
20,550.1
18.0
28.2
STMEF
STMicroelectronics NV
23.15
1.6
20,684.1
19.6
30.5
STWRY
Software AG
8.15
2.4
2,438.4
13.1
31.3
STX
Seagate Technology Plc
57.85
4.4
15,280.8
8.0
35.1
SUMCF
SUMCO Corp.
16.69
341.5
4,894.8
10.2
3,481.8
SVT
Servotronics, Inc.
10.30
1.6
25.6
7.3
11.4
SWDHY
Skyworth Group Ltd.
8.14
2.8
24,916.0
SWKS
Skyworks Solutions, Inc.
90.97
1.7
15,619.8
17.2
29.9
SYMC
Symantec Corp.
22.99
1.3
14,208.6
124.5
162.4
SYZ.V
Sylogist Ltd.
10.00
4.0
236.9
18.9
75.5
TACT
TransAct Technologies, Inc.
12.22
2.9
91.3
20.3
59.8
TAIT
Taitron Components, Inc.
2.59
4.6
14.9
10.8
49.9
TCEHY
Tencent Holdings Ltd.
40.56
0.3
382,906.3
29.4
9.3
TCS.TO
Tecsys Inc.
15.25
1.4
196.4
-190.6
-274.5
TCTZF
Tencent Holdings Ltd.
40.31
2.5
382,337.2
29.2
72.4
TCYSF
TECSYS, Inc.
11.72
1.9
153.3
-202.4
-380.0
TEL
TE Connectivity Ltd.
90.15
2.0
30,284.5
9.6
19.2
TER
Teradyne, Inc.
61.57
0.6
10,667.5
22.0
12.6
TESS
TESSCO Technologies, Inc.
16.08
5.0
137.0
71.1
353.8
TMICF
Trend Micro, Inc.
46.50
350.5
6,462.2
25.2
8,847.2
TOELF
Tokyo Electron Ltd.
203.87
415.5
32,835.2
16.5
6,873.9
TRUHF
Truly International Holdings Ltd.
0.13
0.0
427.6
15.9
0.0
TRUHY
Truly International Holdings Ltd.
2.68
0.0
440.8
16.3
0.0
TSM
Taiwan Semiconductor Manufacturing Co., Ltd.
51.52
3.9
269,209.4
26.0
100.5
TSYHF
TravelSky Technology Ltd.
2.12
14.4
6,203.6
17.6
254.4
TSYHY
TravelSky Technology Ltd.
22.37
1.8
2,064.7
18.6
32.8
TTCNF
Telit Communications Plc
2.10
0.0
277.3
12.9
0.0
TTDKF
TDK Corp.
102.50
280.2
11,719.0
17.6
4,943.6
TXN
Texas Instruments Incorporated
117.79
2.7
110,154.6
21.5
58.5
TYPE
Monotype Imaging Holdings, Inc.
19.84
1.8
833.3
31.9
56.0
UMC
United Microelectronics Corp.
2.28
4.1
5,416.6
56.4
229.2
VCM.TO
Vecima Networks Inc.
9.45
2.3
211.4
-59.1
-137.6
VNWTF
Vecima Networks, Inc.
7.29
3.0
163.1
-62.9
-189.8
VSH
Vishay Intertechnology, Inc.
20.07
1.8
2,932.2
11.5
20.4
VTKLF
VTech Holdings Ltd.
8.40
62.3
2,111.8
12.3
768.3
VTKLY
VTech Holdings Ltd.
8.85
7.6
2,224.9
13.0
98.2
WCAGY
Wirecard AG
63.83
0.2
15,767.0
32.1
5.7
WCRS
Western Capital Resources, Inc.
4.00
5.4
34.7
189.6
1,024.7
WDC
Western Digital Corp.
62.16
3.2
18,476.6
-24.0
-77.2
WIRE
Encore Wire Corp. (Delaware)
55.85
0.1
1,167.6
16.1
2.3
WIT
Wipro Ltd.
3.96
0.4
23,136.8
16.8
6.1
WNXDF
Diebold Nixdorf AG
68.10
0.0
2,030.5
45.6
0.0
WNXDY
Diebold Nixdorf AG
13.03
0.0
1,942.5
43.6
0.0
WRCDF
Wirecard AG
128.13
0.2
15,419.8
32.2
5.2
WSO
Watsco, Inc.
174.74
3.6
6,706.8
WSO.B
Watsco, Inc.
178.89
3.6
6,808.5
WSTG
Wayside Technology Group, Inc.
14.35
4.7
64.7
10.1
48.1
XLNX
Xilinx, Inc.
91.26
2.0
22,948.9
24.2
48.6
XPER
Xperi Corp.
20.54
3.9
1,016.9
32.6
126.4
XPPLF
XP Power Ltd.
34.35
3.1
656.1
19.6
61.1
XRX
Xerox Holdings Corp.
34.12
1.5
7,550.2
11.7
17.2
YAHOF
Z Holdings Corp.
3.01
588.7
14,334.9
23.6
13,919.9
YASKF
YASKAWA Electric Corp.
33.09
235.7
8,663.9
40.5
9,553.0
Ticker Name Price Dividend Yield Market Cap ($M) P/E Ratio Payout Ratio
Alibaba does not currently pay a dividend to shareholders. However, in contrast to other high-growth tech stocks that do not pay dividends and might never, such as Netflix (NFLX), Uber (UBER), and Lyft (LYFT), Alibaba is highly profitable and generates positive free cash flow.
As a result, the company has the capacity to initiate and sustain a dividend for the next several years. Therefore, the big question for income investors is whether the company will ever decide to pay a dividend.
Business Overview
Alibaba is a gigantic e-commerce company, which provides online and mobile commerce businesses in China and in many other international markets.
It operates in four segments: Core commerce, cloud computing, digital media and innovation initiatives. While the company expects meaningful growth from all its segments, its core commerce business is by far its most important, as it generates essentially all the earnings of the company.
The primary concern for Alibaba is that it will be severely affected by the ongoing trade war between the U.S. and China as well as the deceleration of these two economies. In fact, many investors wonder how Alibaba has maintained its strong growth momentum amid the prolonged trade war between the two largest economies in the world.
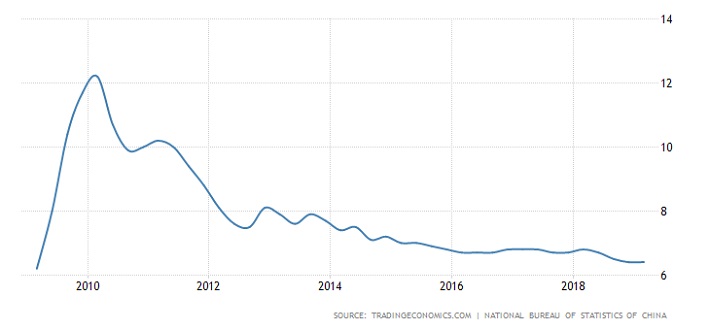
There are four major reasons behind Alibaba’s sustained business momentum amid the prevailing macro challenges. First of all, the company benefits from the strong growth of the Chinese economy. China has grown its gross domestic product by more than 6% per year every single year in the last decade.
Source: Trading Economics
As it is impossible for any country to continue growing at a high single-digit rate indefinitely, the Chinese economy has decelerated in recent years. Nevertheless, it is still growing at a much faster pace than the developed nations, including the U.S. economy.
Moreover, the middle class of China in large cities has exceeded 300 million people and thus it has become almost equal to the entire U.S. population. These consumers seek to upgrade the quality of products they purchase and thus they pursue a great variety of foreign brands. Alibaba, which connects all these people to well-known foreign brands, greatly benefits from this behavior of consumers.
It is also important to note that China’s middle class is expected to double in size within the next 10 years, with most of the growth driven by the less developed cities. Apart from the major metropolitan areas of China, such as Shanghai, Beijing and Shenzhen, China has more than 150 cities with a population of more than 1 million people.
All these cities have more than 500 million people in aggregate and a consumption economy of $2.3 trillion. The economies of these cities grow much faster than the economies of the major metropolitan areas. As a result, consumption from this category of Chinese cities is expected to approximately triple in a decade, from $2.3 trillion this year to about $7.0 trillion in 2029–for a 12% average annual growth rate. This secular trend will provide a strong tailwind to Alibaba, which relies to a great extent on domestic consumption.
Moreover, Alibaba greatly benefits from the fast pace of digitization of the Chinese economy. During the last decade, digitization has been driven primarily by smartphones, which have made it possible for consumers to remain connected to the internet for most of the day. Digitization of the Chinese economy will accelerate even further in the upcoming years thanks to the advent of 5G technology and the fast propagation of IoT (Internet of Things) devices. Alibaba is ideally positioned to benefit from the increasing penetration of Internet in the lives of consumers.
Investors can realize the impact of digitization on Alibaba from the recent reports of the National Bureau of Statistics of China. In July and August, total retail sales in China grew 7.5% over last year’s periods but the online retail sales grew 11% and 17%, respectively, in these two months. It is thus evident that online sales in China have much greater momentum and growth potential than traditional retail sales.
Alibaba stock has incurred a 14% correction off the all-time high it posted in the summer, primarily due to the ongoing trade conflict between the U.S. and China but also due to the somewhat rich valuation of the stock. While the eventual effect of the trade tensions on the Chinese economy is unknown, it is reasonable to assume that Chinese exports will be negatively affected. Consequently, the growth of the Chinese economy may incur a headwind from the outcome of the trade conflicts in the upcoming years.
That said, it is important to note that the Chinese economy will continue growing at a high rate despite its shift from an export economy to a consumption economy. In the last five years, China lost 14 million manufacturing jobs but gained 70 million jobs in services. Overall, Alibaba has exciting growth prospects ahead thanks to the sustained economic growth of China and the secular growth of digitization.
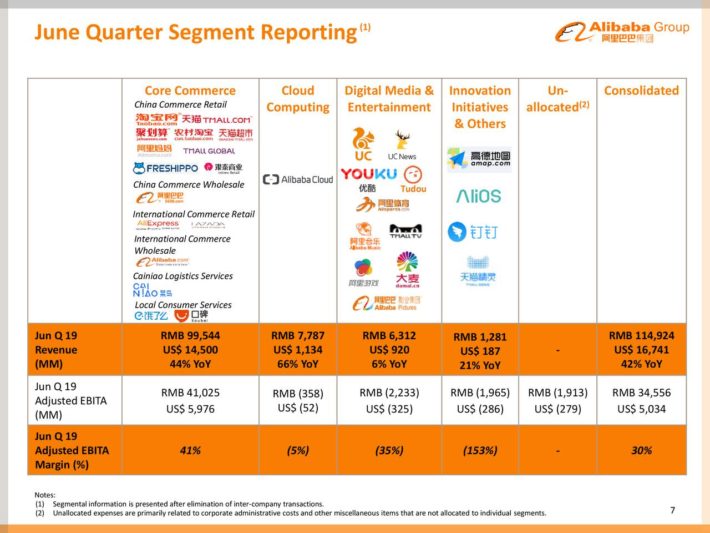
The growth potential of Alibaba was evident in its latest earnings report. In its fiscal first quarter, the online retailer grew its revenue 42% over last year’s quarter, mostly thanks to the strong performance of its core commerce business, which posted 44% revenue growth.
Source: Investor Presentation
This division grew the number of customers from 721 million at the end of the previous quarter, to 755 million.
The cloud business posted 66% revenue growth, thanks to an increase in the number of customers and also average revenue per user.
During the quarter, Alibaba grew private cloud revenue by 250% over last year’s quarter, and management expects this segment to continue growing at a high rate for years. Nevertheless, this segment is still too small to have a meaningful effect in the results of the company.
Source: Investor Presentation
More than 70% of the increase in active consumers came from less developed cities in China. While this trend may fuel some concerns that the company is approaching its limits in its growth trajectory, the high growth rate confirms that the company has ample room to keep growing for several years.
Thanks to its strong business performance, Alibaba grew its adjusted earnings per share by 55%, from $1.01 in last year’s quarter to $1.57. Since its IPO in 2014, the company has almost quadrupled its earnings per share, from $1.61 in 2014 to $5.58 in fiscal 2019. It is also remarkable that Alibaba has exceeded the analysts’ earnings-per-share estimates by a wide margin for four consecutive quarters.
Moreover, Alibaba expects to grow its annual active consumers from 721 million at the end of fiscal 2019 to more than 1.0 billion by the end of fiscal 2024. Furthermore, the online retail giant is expected to grow its earnings per share by 23% in the running fiscal year, and by another 26% in its next fiscal year. As Alibaba does not show any signs of business fatigue, it is likely that the company will continue growing at a fast pace for several more years.
Free Cash Flows
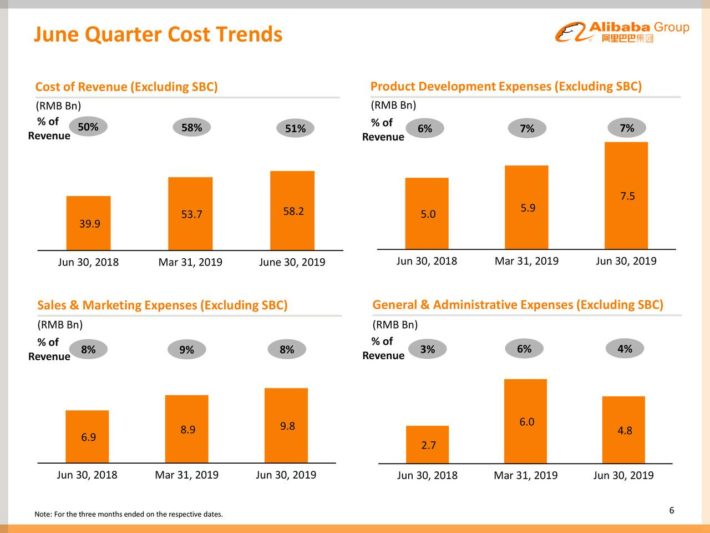
As Alibaba is trying to grow its customer base at a relentless pace, it is investing heavily in its business. More precisely, it spends significant amounts on product development, marketing and general & administrative expenses.
Source: Investor Presentation
All these expenses consume a significant portion of the operating cash flows of the company, and therefore somewhat limit its free cash flow. However, Alibaba has enjoyed positive free cash flows in each of the last seven years. Even better, the online retail giant has strengthened its free cash flows at an impressive pace, from $2.0 billion in 2013 to $14.7 billion in the last 12 months.
In the most recent quarter, the free cash flows of Alibaba remained essentially flat, at $3.8 billion, but they were negatively affected by some non-recurring factors. Going forward, Alibaba is likely to continue growing its free cash flows at a high rate.
This performance greatly differentiates Alibaba from other high-growth tech stocks, such as Netflix, Uber and Lyft. These companies have been growing their revenues at tremendous rates but are still far from achieving positive free cash flows. This is an important difference, as it renders the other stocks much riskier than Alibaba. The higher risk of the other stocks is clearly reflected in the yields of their bonds, which are much higher than the yields of Alibaba’s bonds.
Will Alibaba Ever Pay A Dividend?
Thanks to its positive free cash flows, Alibaba has the financial capacity to initiate a dividend. In addition, the company has a remarkably strong balance sheet. Its net debt is only $18.5 billion, which is only about 1.4 times the annual earnings of the company. Moreover, interest expense consumes only ~8% of the operating income. Therefore, it would not be unreasonable for Alibaba to initiate a dividend in the future.
It is also remarkable that the company repurchased 10.9 million shares in fiscal 2019 and its management confirmed its commitment to continue repurchasing shares to enhance shareholder value. However, it is important to note that the share count increased 0.5% in fiscal 2019.
In other words, Alibaba repurchased shares only to offset the dilutive effect of the shares awarded to its management. Even if this were not the case, the number of shares repurchased was only 0.4% of the total share count. Therefore, investors should not expect meaningful share repurchases from Alibaba.
Moreover, while Alibaba seems to have the financial strength to initiate a dividend, it is not likely to do so for the foreseeable future. The company has initiated the process for a secondary listing, in Hong Kong. Alibaba is expected to raise approximately $15 billion in this secondary listing and use the proceeds to fund its growth initiatives, such as cloud computing and Hema supermarkets.
The process of the secondary listing has been delayed due to the rising political unrest in Hong Kong but Alibaba is expected to launch the offering whenever the prevailing conditions somewhat improve, probably before the end of the year.
Despite the delay in the secondary listing, it is evident that Alibaba is in the process of raising new funds in order to invest in its business instead of returning cash to its shareholders. This should not be viewed as a negative move, as Alibaba has exciting growth prospects. When a company is in a highly profitable business and grows at a fast clip, it is much more rational from an economic point of view to invest cash in the business than to return cash to the shareholders.
The strategy of Alibaba conveys a positive signal, as it implies that there are promising growth prospects ahead. In fact, whenever Alibaba initiates a dividend, its stock will probably come under pressure, as investors will fear that the high-growth era of the company is coming to an end.
Final Thoughts
Alibaba greatly benefits from the sustained growth of the Chinese economy and the secular growth of digitization. The e-commerce giant has been growing its revenues, earnings, and free cash flows at an impressive rate for many years.
Moreover, in contrast to other popular high-growth stocks, Alibaba is already strongly profitable with positive free cash flow. In addition, it has a strong balance sheet, which collectively means that the company could initiate a dividend without facing any financial stress.
However, Alibaba is still in its high-growth phase, with ample room to continue growing at a high rate for several more years. As a result, it makes much more sense to continue invest in its business than to return cash to its shareholders right now.
This is clearly reflected in its strategy, which is executing a secondary listing in Hong Kong in an effort to raise approximately $15 billion and use the proceeds to fund its growth initiatives. For all these reasons, investors should not expect a dividend from the online retail giant for the next several years at least.