


Spreadsheet data updated daily
The technology industry is one of the most exciting areas of the stock market, known for its rapid growth and propensity to create rapid and life-changing wealth for early investors.
Until recently, the technology was not known for being a source of high-quality dividend investment ideas. This is no longer the case. Today, many of the most appealing dividend stocks come from this enticing sector.
With that in mind, we’ve compiled a list of all ~330 dividend-paying technology stocks complete with important investing metrics, which you can access below:
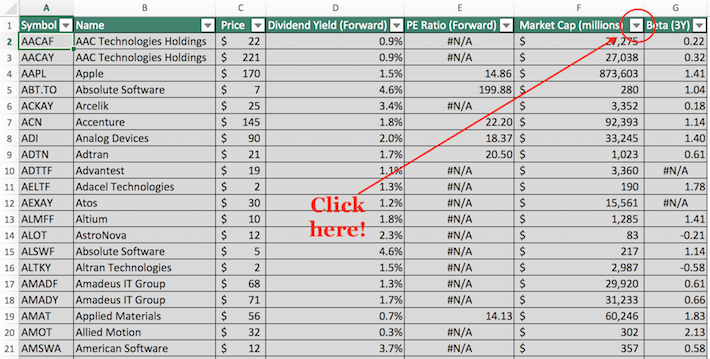
You can view a preview of our technology stocks spreadsheet below:
| AACAF | AAC Technologies Holdings, Inc. | 5.81 | 3.1 | 7,021.4 | 17.4 | 54.5 |
| AACAY | AAC Technologies Holdings, Inc. | 5.78 | 2.7 | 6,936.8 | 17.3 | 46.6 |
| AAPL | Apple, Inc. | 236.41 | 1.3 | 1,068,379.3 | 20.0 | 25.0 |
| ABT.TO | Absolute Software Corporation | 7.63 | 4.2 | 318.6 | 42.4 | 176.8 |
| ACKAY | Arçelik AS | 15.88 | 0.0 | 2,146.1 | 12.3 | 0.0 |
| ACN | Accenture Plc | 187.08 | 1.6 | 119,196.3 | 25.0 | 39.0 |
| ADI | Analog Devices, Inc. | 109.48 | 1.9 | 40,442.6 | 26.8 | 49.9 |
| ADTN | ADTRAN, Inc. | 9.63 | 3.7 | 460.6 | 117.7 | 440.1 |
| ADTTF | Advantest Corp. | 26.75 | 3.1 | 5,294.6 | 10.4 | 32.1 |
| AELTF | Adacel Technologies Ltd. | 0.33 | 0.0 | 25.2 | -13.4 | 0.0 |
| AEXAY | ATOS SE | 14.97 | 1.9 | 7,956.3 | 10.9 | 20.3 |
| ALMFF | Altium Ltd. | 23.29 | 1.1 | 2,955.9 | 57.4 | 61.8 |
| ALOT | AstroNova, Inc. | 15.75 | 1.8 | 111.0 | 17.2 | 30.6 |
| ALSWF | Absolute Software Corp. | 5.70 | 4.2 | 237.8 | 30.8 | 130.6 |
| ALTKY | Altran Technologies SA | 1.53 | 0.0 | 3,894.8 | 32.6 | 0.0 |
| AMADF | Amadeus IT Group SA | 72.20 | 0.0 | 31,115.6 | 26.3 | 0.0 |
| AMADY | Amadeus IT Group SA | 73.43 | 0.0 | 31,593.9 | 26.8 | 0.0 |
| AMAT | Applied Materials, Inc. | 51.68 | 1.6 | 47,739.6 | 17.0 | 27.0 |
| AMOT | Allied Motion Technologies, Inc. | 35.91 | 0.3 | 344.7 | 20.4 | 6.8 |
| AMSWA | American Software, Inc. | 15.81 | 2.8 | 495.9 | 74.8 | 208.1 |
| APELY | Alps Alpine Co., Ltd. | 39.31 | 0.0 | 4,051.5 | 24.7 | 0.0 |
| APH | Amphenol Corp. | 99.00 | 0.9 | 29,447.4 | 24.4 | 22.7 |
| ARLUF | Aristocrat Leisure Ltd. | 21.20 | 1.7 | 13,509.8 | 29.4 | 49.6 |
| ASMIY | ASM International NV | 95.23 | 0.0 | 4,240.8 | 16.4 | 0.0 |
| ASML | ASML Holding NV | 254.42 | 1.2 | 107,147.2 | 40.9 | 47.8 |
| ASMLF | ASML Holding NV | 251.82 | 1.4 | 106,052.3 | 41.9 | 59.5 |
| ASMVF | ASM Pacific Technology Ltd. | 12.80 | 2.7 | 5,200.4 | 41.0 | 110.4 |
| ASMVY | ASM Pacific Technology Ltd. | 39.43 | 2.4 | 5,339.9 | 42.1 | 99.7 |
| ASOZF | Asseco Poland SA | 12.68 | 0.0 | 1,052.4 | 11.8 | 0.0 |
| ASOZY | Asseco Poland SA | 11.65 | 0.0 | 967.0 | 10.8 | 0.0 |
| ASX | ASE Technology Holding Co., Ltd. | 5.02 | 0.0 | 10,669.6 | 20.0 | 0.0 |
| ATDRY | Auto Trader Group Plc | 1.73 | 1.0 | 6,134.8 | 25.1 | 25.7 |
| ATEYY | Advantest Corp. | 49.95 | 0.0 | 9,641.2 | 19.4 | 0.0 |
| ATVI | Activision Blizzard, Inc. | 54.54 | 0.6 | 41,833.6 | 24.7 | 15.4 |
| AUKUF | ams AG | 46.05 | 0.0 | 3,722.5 | 44.1 | 0.0 |
| AVEVF | AVEVA Group Plc | 49.65 | 1.1 | 8,000.9 | 183.7 | 207.8 |
| AVGO | Broadcom, Inc. | 286.73 | 3.4 | 113,737.5 | 38.7 | 130.8 |
| AVT | Avnet, Inc. | 41.65 | 1.9 | 4,213.8 | 26.5 | 51.4 |
| AVX | AVX Corp. | 16.18 | 2.8 | 2,735.9 | 10.1 | 28.7 |
| AYI | Acuity Brands, Inc. | 123.92 | 0.4 | 4,904.8 | 14.9 | 6.3 |
| BBOX | Black Box Corporation | 0.00 | 0.0 | 0.0 | ||
| BCNAF | Barco NV | 211.27 | 0.0 | 2,634.8 | 25.5 | 0.0 |
| BDC | Belden, Inc. | 53.39 | 0.4 | 2,426.7 | 13.2 | 4.9 |
| BELFA | Bel Fuse, Inc. | 11.48 | 2.4 | 141.4 | 8.0 | 19.6 |
| BELFB | Bel Fuse, Inc. | 13.51 | 2.1 | 166.4 | 8.2 | 17.1 |
| BKTI | BK Technologies Corp. | 3.58 | 2.2 | 45.5 | -20.3 | -45.4 |
| BLKB | Blackbaud, Inc. | 86.38 | 0.6 | 4,247.6 | 154.4 | 85.8 |
| BMI | Badger Meter, Inc. | 60.17 | 1.0 | 1,751.8 | 37.8 | 39.0 |
| BRKS | Brooks Automation, Inc. | 40.10 | 1.0 | 2,871.6 | 80.8 | 81.3 |
| BVILF | Breville Group Ltd. | 11.50 | 2.3 | 1,499.4 | 30.9 | 71.2 |
| BVILY | Breville Group Ltd. | 18.05 | 2.4 | 1,176.7 | 24.3 | 58.1 |
| BYDIF | BYD Electronic (International) Co., Ltd. | 1.51 | 0.0 | 3,402.3 | 14.3 | 0.0 |
| CA | CA, Inc. | 0.00 | 0.0 | 0.0 | ||
| CBLNY | Mersen SA | 6.42 | 0.0 | 661.6 | 9.4 | 0.0 |
| CCMP | Cabot Microelectronics Corp. | 147.57 | 1.1 | 4,243.0 | 37.2 | 41.7 |
| CCOEF | Capcom Co., Ltd. | 25.75 | 1.2 | 2,748.8 | 21.8 | 26.8 |
| CCUR | CCUR Holdings, Inc. | 3.50 | 0.0 | 31.2 | 43.1 | 0.0 |
| CDK | CDK Global, Inc. | 48.90 | 1.2 | 5,867.6 | 52.6 | 65.4 |
| CDW | CDW Corp. | 123.91 | 0.9 | 17,931.6 | 26.5 | 23.4 |
| CGEMY | Capgemini SE | 24.23 | 0.0 | 20,250.2 | 22.0 | 0.0 |
| CGNX | Cognex Corp. | 51.86 | 0.4 | 8,710.5 | 42.9 | 16.4 |
| CIOXF | Cielo SA | 8.77 | 2.4 | 23,797.9 | 36.8 | 87.5 |
| CIOXY | Cielo SA | 1.80 | 9.8 | 4,884.4 | 7.6 | 74.2 |
| CLRO | ClearOne, Inc. | 1.75 | 0.0 | 29.1 | -1.1 | 0.0 |
| CMG.TO | Computer Modelling Group Ltd. | 6.32 | 6.3 | 515.9 | 21.1 | 132.5 |
| CMI.V | C-Com Satellite Systems Inc. | 1.75 | 2.8 | 66.1 | 25.0 | 71.0 |
| CMPVF | CompuGroup Medical SE | 78.15 | 0.0 | 3,845.4 | 41.2 | 0.0 |
| CMSQF | Computershare Ltd. | 10.85 | 2.9 | 5,891.1 | 14.2 | 41.1 |
| CMTL | Comtech Telecommunications Corp. | 32.68 | 1.2 | 785.1 | 31.5 | 38.9 |
| CNSWF | Constellation Software, Inc. | 983.03 | 0.4 | 20,849.1 | 51.5 | 21.0 |
| COHU | Cohu, Inc. | 15.03 | 1.6 | 617.7 | -6.7 | -10.6 |
| CPSI | Computer Programs & Systems, Inc. | 22.80 | 1.8 | 327.3 | 17.5 | 30.6 |
| CRWRY | 0.00 | 0.0 | 0.0 | |||
| CSCO | Cisco Systems, Inc. | 46.71 | 2.9 | 198,297.5 | 17.8 | 51.7 |
| CSGS | CSG Systems International, Inc. | 50.57 | 1.7 | 1,669.2 | 21.6 | 36.9 |
| CSIOF | Casio Computer Co., Ltd. | 1.00 | 40.6 | 243.3 | 1.2 | 50.0 |
| CSPI | CSP, Inc. | 12.97 | 4.6 | 53.9 | -39.5 | -182.6 |
| CSSXF | China Singyes Solar Technologies Holdings Ltd. | 0.10 | 0.0 | 83.4 | -0.4 | 0.0 |
| CSU.TO | Constellation Software Inc. | 1,307.49 | 0.4 | 27,305.0 | 68.5 | 27.4 |
| CSVI | Computer Services, Inc. | 44.49 | 1.6 | 1,228.7 | 26.0 | 42.3 |
| CSXXY | carsales.com Ltd. | 21.27 | 2.7 | 2,607.1 | 43.0 | 114.2 |
| CSYJF | CSE Global Ltd. | 0.33 | 0.0 | 167.4 | 11.3 | 0.0 |
| CSYJY | CSE Global Ltd. | 3.37 | 5.2 | 171.2 | 11.5 | 60.2 |
| CTS | CTS Corp. | 33.60 | 0.5 | 1,097.7 | 21.6 | 10.3 |
| CY | Cypress Semiconductor Corp. | 23.42 | 1.9 | 8,656.7 | 26.1 | 49.0 |
| DAKT | Daktronics, Inc. | 7.20 | 3.6 | 323.6 | 207.5 | 749.3 |
| DASTF | Dassault Systèmes SA | 147.41 | 0.0 | 38,150.2 | 56.0 | 0.0 |
| DASTY | Dassault Systèmes SA | 150.50 | 0.0 | 39,423.6 | 57.2 | 0.0 |
| DBD | Diebold Nixdorf, Inc. | 9.15 | 0.0 | 694.6 | -1.3 | 0.0 |
| DCHIY | Digital China Holdings Ltd. | 2.68 | 0.0 | 895.6 | 570.2 | 0.0 |
| DNACF | DeNA Co., Ltd. | 17.25 | 0.0 | 2,508.2 | 27.9 | 0.0 |
| DOX | Amdocs Ltd. | 65.90 | 1.6 | 8,982.3 | 22.7 | 36.7 |
| DXC | DXC Technology Co. | 26.44 | 3.0 | 6,926.3 | 6.2 | 18.4 |
| EBIX | Ebix, Inc. | 39.29 | 0.8 | 1,175.4 | 13.1 | 10.2 |
| EGHSF | Enghouse Systems Ltd. | 26.27 | 1.1 | 1,436.8 | 28.9 | 31.5 |
| ELUXF | Electrolux AB | 24.00 | 0.0 | 6,897.5 | 16.0 | 0.0 |
| ELUXY | Electrolux AB | 52.45 | 0.0 | 7,322.2 | 17.4 | 0.0 |
| ENGH.TO | Enghouse Systems Limited | 36.85 | 1.2 | 1,991.0 | 30.7 | 36.5 |
| ENR | Energizer Holdings, Inc. | 40.45 | 3.0 | 2,773.3 | 348.7 | 1,031.0 |
| ENS | EnerSys | 66.16 | 1.1 | 2,777.5 | 17.2 | 18.4 |
| ERIC | Telefonaktiebolaget LM Ericsson | 9.12 | 0.0 | 27,939.7 | 2,026.7 | 0.0 |
| ERIXF | Telefonaktiebolaget LM Ericsson | 9.05 | 0.0 | 29,913.0 | 2,011.1 | 0.0 |
| ESE | ESCO Technologies, Inc. | 82.42 | 0.4 | 2,141.4 | 25.2 | 9.8 |
| ESP | Espey Manufacturing & Electronics Corp. | 22.11 | 4.5 | 53.1 | 22.5 | 101.6 |
| ET.TO | Evertz Technologies Limited | 16.85 | 4.5 | 1,293.0 | 17.6 | 78.3 |
| EUTLF | Eutelsat Communications SA | 19.69 | 7.3 | 4,576.9 | 11.8 | 86.0 |
| EVSBY | EVS Broadcast Equipment S.A. | 0.00 | 0.0 | 0.0 | ||
| EVTC | EVERTEC, Inc. | 31.19 | 0.6 | 2,243.5 | 23.3 | 15.0 |
| EVTZF | Evertz Technologies Ltd. | 12.03 | 4.5 | 921.6 | 16.5 | 74.8 |
| FDGRY | 0.00 | 0.0 | 0.0 | |||
| FDRVF | First Derivatives Plc | 28.54 | 1.3 | 745.4 | 42.6 | 53.9 |
| FELTF | Fuji Electric Co., Ltd. | 39.80 | 1.8 | 5,685.2 | 16.8 | 30.5 |
| FICO | Fair Isaac Corp. | 302.01 | 0.0 | 8,722.8 | 46.6 | 0.0 |
| FJTSF | Fujitsu Ltd. | 83.45 | 1.6 | 16,913.8 | 47.2 | 76.6 |
| FLIR | FLIR Systems, Inc. | 52.89 | 1.2 | 7,172.2 | 25.9 | 32.3 |
| FORTY | Formula Systems (1985) Ltd. | 67.50 | 0.9 | 1,032.4 | 27.6 | 24.8 |
| FSOYF | F-Secure Oyj | 3.03 | 0.0 | 478.1 | 132.3 | 0.0 |
| FTV | Fortive Corp. | 70.94 | 0.4 | 23,802.7 | 9.1 | 3.6 |
| FUWAF | Furukawa Electric Co., Ltd. | 25.00 | 6.2 | 1,828.0 | ||
| FUWAY | Furukawa Electric Co., Ltd. | 12.90 | 0.0 | 1,818.5 | 7.2 | 0.0 |
| GLW | Corning, Inc. | 29.33 | 2.6 | 22,902.8 | 16.5 | 42.6 |
| GREZF | GREE, Inc. | 4.10 | 2.2 | 943.9 | 30.8 | 68.3 |
| GRMN | Garmin Ltd. | 87.46 | 2.5 | 16,626.3 | 22.4 | 55.2 |
| GSB | GlobalSCAPE, Inc. | 11.08 | 0.3 | 192.0 | 19.4 | 5.2 |
| GTOFF | Gemalto Holding BV | 56.40 | 0.0 | 5,116.6 | 72.0 | 0.0 |
| GTOMY | Gemalto Holding BV | 28.11 | 0.0 | 5,100.2 | 71.8 | 0.0 |
| GYUAF | GS Yuasa Corp. | 20.55 | 2.2 | 1,667.3 | 13.9 | 30.5 |
| HIMX | Himax Technologies, Inc. | 2.39 | 0.0 | 406.3 | 217.3 | 0.0 |
| HNHPF | Hon Hai Precision Industry Co., Ltd. | 5.14 | 0.0 | 70,555.1 | 8.8 | 0.0 |
| HOCPF | HOYA Corp. | 83.70 | 1.0 | 31,604.5 | 28.6 | 27.7 |
| HPE | Hewlett-Packard Enterprise Co. | 15.35 | 2.9 | 20,041.0 | -148.0 | -433.9 |
| HPHTF | Hamamatsu Photonics KK | 37.13 | 1.0 | 5,747.7 | 30.8 | 29.9 |
| HPQ | HP, Inc. | 16.85 | 3.7 | 24,970.2 | 6.1 | 22.6 |
| HPS.A.TO | Hammond Power Solutions Inc. | 8.07 | 3.5 | 95.0 | -12.2 | -43.0 |
| HRELF | Haier Electronics Group Co., Ltd. | 2.70 | 0.0 | 7,554.2 | 13.1 | 0.0 |
| HRS | Harris Corp. | 189.13 | 1.4 | 22,341.2 | 24.9 | 34.6 |
| HTHIF | Hitachi Ltd. | 36.43 | 2.1 | 35,200.9 | 16.2 | 34.1 |
| HTHIY | Hitachi Ltd. | 76.20 | 0.0 | 7,344.5 | 3.4 | 0.0 |
| HURC | Hurco Cos., Inc. | 32.17 | 1.4 | 217.7 | 9.2 | 13.2 |
| HXGBF | Hexagon AB | 47.40 | 0.0 | 17,341.4 | 21.2 | 0.0 |
| HXGBY | Hexagon AB | 49.34 | 0.0 | 16,727.9 | 22.0 | 0.0 |
| IBIDF | IBIDEN Co., Ltd. | 19.70 | 1.6 | 2,752.8 | 83.3 | 133.7 |
| IBM | International Business Machines Corp. | 134.09 | 4.8 | 118,787.0 | 15.5 | 73.7 |
| IFNNF | Infineon Technologies AG | 18.91 | 0.0 | 22,541.2 | 22.2 | 0.0 |
| IFNNY | Infineon Technologies AG | 18.84 | 0.0 | 22,690.5 | 22.1 | 0.0 |
| IIJI | 0.00 | 0.0 | 0.0 | |||
| INFY | Infosys Ltd. | 9.30 | 2.1 | 45,398.6 | 18.2 | 39.0 |
| INTC | Intel Corp. | 51.36 | 2.4 | 227,524.8 | 11.8 | 28.2 |
| INTU | Intuit, Inc. | 262.47 | 0.7 | 68,261.6 | 43.8 | 31.4 |
| ISDR | Issuer Direct Corp. | 10.90 | 0.5 | 42.1 | 73.3 | 33.6 |
| ITRN | Ituran Location & Control Ltd. | 25.06 | 3.8 | 525.5 | 9.3 | 34.9 |
| ITTOF | ITOCHU Techno-Solutions Corp. | 23.20 | 1.9 | 5,359.9 | 23.2 | 45.2 |
| JBL | Jabil, Inc. | 36.20 | 0.9 | 5,536.0 | 19.8 | 17.5 |
| JCOM | j2 Global, Inc. | 94.83 | 1.9 | 4,611.9 | 31.4 | 58.7 |
| JCS | Communications Systems, Inc. | 4.29 | 2.3 | 40.0 | 58.4 | 136.1 |
| JEHLY | Johnson Electric Holdings Ltd. | 17.71 | 3.3 | 1,569.2 | 5.5 | 17.7 |
| JELCF | Johnson Electric Holdings Ltd. | 1.86 | 3.5 | 1,648.1 | 5.7 | 20.0 |
| JNPR | Juniper Networks, Inc. | 23.90 | 3.1 | 8,265.0 | 16.8 | 51.9 |
| KACPF | KOA CORPORATION | 0.00 | 0.0 | 0.0 | ||
| KDCXF | Kudelski SA | 9.47 | 0.0 | 518.3 | -46.4 | 0.0 |
| KLAC | KLA Corp. | 159.69 | 1.9 | 25,305.0 | 21.1 | 39.7 |
| KNAMF | Konami Holdings Corp. | 41.86 | 2.7 | 5,660.8 | 19.0 | 51.5 |
| KNMCY | Konami Holdings Corp. | 46.95 | 0.0 | 6,349.2 | 21.3 | 0.0 |
| KSFTF | Kingsoft Corp. Ltd. | 2.27 | 0.0 | 3,099.8 | -16.1 | 0.0 |
| KYCCF | KEYENCE Corp. | 612.20 | 0.3 | 75,421.4 | 38.0 | 11.0 |
| KYOCF | Kyocera Corp. | 62.00 | 2.0 | 22,428.7 | 26.7 | 54.4 |
| KYOCY | Kyocera Corp. | 63.89 | 0.0 | 23,112.4 | 27.5 | 0.0 |
| LARRF | Laird PLC | 0.00 | 0.0 | 0.0 | ||
| LDOS | Leidos Holdings, Inc. | 81.62 | 1.6 | 11,737.6 | 18.2 | 28.5 |
| LFUS | Littelfuse, Inc. | 190.23 | 0.9 | 4,606.8 | 28.4 | 26.1 |
| LNVGF | Lenovo Group Ltd. | 0.71 | 0.0 | 8,470.4 | 12.3 | 0.0 |
| LNVGY | Lenovo Group Ltd. | 13.75 | 0.0 | 8,230.1 | 12.0 | 0.0 |
| LOGI | Logitech International SA | 40.46 | 0.0 | 6,666.9 | 25.4 | 0.0 |
| LPL | LG Display Co., Ltd. | 6.23 | 0.0 | 4,250.9 | -11.4 | 0.0 |
| LRCX | Lam Research Corp. | 233.70 | 1.9 | 33,847.7 | 16.3 | 30.6 |
| LYTS | LSI Industries, Inc. | 5.37 | 3.7 | 140.8 | -8.6 | -31.9 |
| MANT | ManTech International Corp. | 69.23 | 1.5 | 2,768.6 | 31.5 | 47.3 |
| MAXR | Maxar Technologies, Inc. | 7.68 | 7.6 | 457.8 | -0.4 | -2.9 |
| MAXR.TO | Maxar Technologies Inc. | 10.21 | 0.5 | 602.8 | -0.5 | -0.3 |
| MCFUF | Micro Focus International Plc | 15.60 | 12.9 | 5,199.8 | -14.6 | -188.9 |
| MCHP | Microchip Technology, Inc. | 95.00 | 1.5 | 22,614.2 | 60.5 | 92.9 |
| MCRNF | Micro-Mechanics (Holdings) Ltd. | 1.00 | 0.0 | 139.0 | 14.7 | 0.0 |
| MDF.TO | Mediagrif Interactive Technologies Inc. | 6.50 | 5.8 | 97.5 | -3.6 | -20.8 |
| MEI | Methode Electronics, Inc. | 33.45 | 1.3 | 1,240.7 | 13.0 | 17.1 |
| MGIC | Magic Software Enterprises Ltd. | 9.01 | 3.4 | 440.5 | 22.3 | 75.4 |
| MIELF | Mitsubishi Electric Corp. | 13.55 | 2.7 | 29,066.2 | 14.6 | 38.8 |
| MIXIF | mixi, Inc. | 19.47 | 5.6 | 1,467.1 | 8.0 | 44.5 |
| MIXT | MiX Telematics Ltd. | 12.72 | 1.4 | 288.3 | 15.9 | 22.7 |
| MKSI | MKS Instruments, Inc. | 95.52 | 0.8 | 5,139.6 | 24.1 | 20.5 |
| MLAB | Mesa Laboratories, Inc. | 213.21 | 0.3 | 929.2 | 105.4 | 31.6 |
| MNBEF | Minebea Mitsumi, Inc. | 17.30 | 1.5 | 7,181.8 | 15.7 | 22.9 |
| MNBEY | Minebea Mitsumi, Inc. | 34.63 | 0.0 | 7,188.0 | 15.7 | 0.0 |
| MNDO | MIND C.T.I. Ltd. | 2.34 | 0.0 | 46.4 | 8.5 | 0.0 |
| MPWR | Monolithic Power Systems, Inc. | 144.01 | 1.0 | 6,145.4 | 57.9 | 57.0 |
| MRAAF | Murata Manufacturing Co. Ltd. | 54.86 | 1.5 | 34,867.4 | 18.2 | 28.1 |
| MRVL | Marvell Technology Group Ltd. | 23.93 | 1.0 | 15,794.6 | -37.5 | -38.0 |
| MSFT | Microsoft Corp. | 137.41 | 1.3 | 1,049,181.7 | 26.9 | 36.0 |
| MSI | Motorola Solutions, Inc. | 175.05 | 1.3 | 29,155.6 | 27.9 | 35.5 |
| MTHRF | M3, Inc. | 24.12 | 0.0 | 16,363.4 | 88.4 | 0.0 |
| MTSC | MTS Systems Corp. | 54.86 | 2.2 | 1,060.7 | 21.5 | 47.1 |
| MXIM | Maxim Integrated Products, Inc. | 57.75 | 3.2 | 15,655.8 | 19.2 | 61.0 |
| NATI | National Instruments Corp. | 40.95 | 2.4 | 5,357.2 | 35.7 | 84.5 |
| NEXOF | NEXON Co., Ltd. | 11.50 | 0.0 | 10,318.8 | 11.2 | 0.0 |
| NICE | NICE Ltd. (Israel) | 147.75 | 0.0 | 9,276.6 | 50.9 | 0.0 |
| NOK | Nokia Oyj | 5.22 | 0.0 | 29,137.1 | -49.1 | 0.0 |
| NOKBF | Nokia Oyj | 5.33 | 0.0 | 29,865.5 | -50.1 | 0.0 |
| NPEGF | Nippon Electric Glass Co., Ltd. | 25.72 | 3.5 | 2,485.0 | 22.1 | 77.0 |
| NPSNY | Naspers Ltd. | 30.99 | 0.2 | 67,725.7 | 4.8 | 1.0 |
| NTAP | NetApp, Inc. | 53.49 | 3.1 | 12,726.0 | 13.4 | 42.2 |
| NTDOF | Nintendo Co., Ltd. | 350.00 | 2.1 | 42,451.2 | 26.1 | 53.7 |
| NTDOY | Nintendo Co., Ltd. | 44.34 | 0.0 | 42,351.1 | 26.5 | 0.0 |
| NTES | NetEase, Inc. | 286.03 | 0.9 | 36,600.6 | 28.6 | 26.5 |
| NTP | Nam Tai Property, Inc. | 9.01 | 0.8 | 344.1 | -22.9 | -17.8 |
| NVDA | NVIDIA Corp. | 190.49 | 0.3 | 116,008.4 | 42.3 | 14.0 |
| NVEC | NVE Corp. | 64.92 | 6.2 | 314.6 | 22.2 | 136.8 |
| NXCLF | Lifull Co., Ltd. | 6.25 | 0.9 | 838.5 | 33.2 | 28.7 |
| OMRNY | OMRON Corp. | 58.09 | 0.0 | 11,966.4 | 27.7 | 0.0 |
| OPESY | 0.00 | 0.0 | 0.0 | |||
| ORCL | Oracle Corp. | 54.55 | 1.6 | 179,061.5 | 17.3 | 27.3 |
| OSAGF | OSRAM Licht AG | 44.33 | 0.0 | 4,278.7 | -17.5 | 0.0 |
| OTEX | Open Text Corp. | 39.96 | 1.6 | 10,622.3 | 37.6 | 60.2 |
| OTEX.TO | Open Text Corporation | 53.67 | 1.7 | 13,891.0 | 50.6 | 87.1 |
| OXINF | Oxford Instruments Plc | 16.20 | 1.2 | 927.0 | 24.7 | 28.7 |
| PCRFF | Panasonic Corp. | 8.20 | 3.3 | 19,127.8 | 7.7 | 25.3 |
| PCRFY | Panasonic Corp. | 8.30 | 0.0 | 19,221.1 | 7.8 | 0.0 |
| PCTI | PCTEL, Inc. | 8.09 | 2.7 | 148.3 | -13.8 | -37.7 |
| PEGA | Pegasystems, Inc. | 74.39 | 0.2 | 5,870.8 | -112.3 | -18.2 |
| PKE | Park Aerospace Corp. | 16.29 | 2.5 | 334.2 | 33.2 | 81.6 |
| PLPC | Preformed Line Products Co. | 51.31 | 1.6 | 258.1 | 10.7 | 16.7 |
| PLT | Plantronics, Inc. | 37.49 | 1.6 | 1,483.7 | -7.6 | -12.1 |
| PMCUF | Pro Medicus Ltd. | 21.56 | 0.3 | 2,204.4 | 163.2 | 44.0 |
| POWI | Power Integrations, Inc. | 92.59 | 0.7 | 2,692.0 | 46.3 | 33.3 |
| PRYMF | Prysmian SpA | 22.30 | 0.0 | 5,867.3 | 21.1 | 0.0 |
| PRYMY | Prysmian SpA | 11.41 | 0.0 | 5,904.2 | 21.6 | 0.0 |
| PTFRY | PT Tower Bersama Infrastructure Tbk | 22.39 | 0.0 | 1,950.7 | 41.8 | 0.0 |
| PTG.TO | Pivot Technology Solutions, Inc. | 1.45 | 11.0 | 57.6 | -13.2 | -145.4 |
| PXGYF | PAX Global Technology Ltd. | 0.37 | 2.8 | 407.1 | 5.4 | 14.9 |
| QADA | QAD, Inc. | 44.78 | 0.5 | 911.1 | -58.6 | -31.4 |
| QADB | QAD, Inc. | 35.88 | 0.7 | 730.0 | -58.7 | -39.3 |
| QCOM | QUALCOMM, Inc. | 77.68 | 3.2 | 94,432.5 | 27.3 | 87.0 |
| QTRH | Quarterhill, Inc. | 1.23 | 3.1 | 146.1 | -4.3 | -13.3 |
| QTRH.TO | Quarterhill Inc. | 1.65 | 3.0 | 193.7 | -5.8 | -17.4 |
| RELL | Richardson Electronics Ltd. | 5.75 | 4.2 | 75.5 | -9.7 | -40.5 |
| RFIL | RF Industries Ltd. | 6.48 | 1.2 | 60.9 | 18.9 | 23.4 |
| RHDGF | Retail Holdings NV | 2.25 | 44.4 | 11.6 | -0.5 | -23.5 |
| RNSHF | Renishaw Plc | 49.00 | 1.6 | 3,566.6 | 29.9 | 47.3 |
| RPGRF | REA Group Ltd. | 45.00 | 1.9 | 5,927.2 | 79.9 | 149.7 |
| RSTAY | RIB Software SE | 48.27 | 0.0 | 1,179.0 | 55.2 | 0.0 |
| RTMVF | Rightmove Plc | 6.59 | 1.3 | 5,793.2 | 26.9 | 36.0 |
| RTMVY | Rightmove Plc | 14.82 | 1.0 | 6,439.3 | 30.3 | 30.3 |
| SABR | Sabre Corp. | 21.05 | 2.7 | 5,717.1 | 23.9 | 64.2 |
| SAIC | Science Applications International Corp. | 81.35 | 1.7 | 4,814.3 | 28.7 | 48.0 |
| SAP | SAP SE | 131.58 | 0.0 | 154,129.6 | 41.2 | 0.0 |
| SAPGF | SAP SE | 130.54 | 0.0 | 153,974.4 | 40.8 | 0.0 |
| SCND | Scientific Industries, Inc. | 9.75 | 0.0 | 14.6 | 22.6 | 0.0 |
| SEKEF | Seiko Epson Corp. | 13.64 | 4.1 | 4,755.5 | 12.6 | 51.6 |
| SEPJF | Spectris Plc | 29.30 | 2.8 | 3,396.9 | 54.9 | 151.4 |
| SEPJY | Spectris Plc | 16.32 | 2.1 | 3,784.1 | 61.2 | 128.6 |
| SGAMF | Sega Sammy Holdings, Inc. | 14.29 | 2.5 | 3,354.3 | 90.1 | 227.6 |
| SGPYY | The Sage Group Plc | 36.23 | 2.1 | 9,864.1 | 23.8 | 50.9 |
| SILC | Silicom Ltd. | 31.41 | 0.0 | 238.7 | 12.1 | 0.0 |
| SIMO | Silicon Motion Technology Corp. | 38.34 | 0.0 | 1,384.2 | 17.4 | 0.0 |
| SKLTF | SEEK Ltd. | 12.57 | 2.6 | 4,408.7 | 34.2 | 89.5 |
| SKSJF | Shinko Shoji Co., Ltd. | 7.83 | 3.2 | 293.6 | 26.0 | 82.5 |
| SLP | Simulations Plus, Inc. | 34.58 | 0.7 | 606.2 | 76.8 | 53.3 |
| SMTGF | SMA Solar Technology AG | 26.65 | 0.0 | 924.8 | -4.0 | 0.0 |
| SMTOF | Sumitomo Electric Industries Ltd. | 12.96 | 3.3 | 10,107.4 | 10.9 | 36.5 |
| SNE | Sony Corp. | 59.27 | 0.0 | 73,823.3 | 9.9 | 0.0 |
| SNEJF | Sony Corp. | 59.92 | 0.5 | 74,708.5 | 10.1 | 5.3 |
| SNPTF | Sunny Optical Technology (Group) Co., Ltd. | 15.14 | 0.0 | 16,014.0 | 41.3 | 0.0 |
| SPHHF | Sophos Group Plc | 7.28 | 0.7 | 3,553.2 | 128.8 | 96.6 |
| SQNXF | Square Enix Holdings Co., Ltd. | 47.27 | 0.9 | 5,634.9 | 37.2 | 33.5 |
| SRMC | Sierra Monitor Corp. | 3.24 | 1.2 | 33.2 | 206.4 | 254.8 |
| SSNC | SS&C Technologies Holdings, Inc. | 50.08 | 0.7 | 12,723.5 | 39.2 | 28.2 |
| STM | STMicroelectronics NV | 21.31 | 1.0 | 18,902.0 | 17.0 | 16.4 |
| STMEF | STMicroelectronics NV | 21.35 | 1.1 | 19,116.9 | 17.0 | 19.5 |
| STWRY | Software AG | 6.63 | 0.0 | 1,961.9 | 10.6 | 0.0 |
| STX | Seagate Technology Plc | 54.98 | 4.6 | 14,522.7 | 7.6 | 35.1 |
| SUMCF | SUMCO Corp. | 15.92 | 3.2 | 4,669.0 | 9.7 | 31.2 |
| SVT | Servotronics, Inc. | 10.25 | 1.6 | 25.5 | 7.3 | 11.4 |
| SWDHY | Skyworth Group Ltd. | 8.14 | 0.0 | 24,916.0 | ||
| SWKS | Skyworks Solutions, Inc. | 87.77 | 1.7 | 15,070.4 | 16.6 | 28.8 |
| SYMC | Symantec Corp. | 23.01 | 1.3 | 14,220.9 | 124.6 | 162.4 |
| SYZ.V | Sylogist Ltd. | 10.60 | 3.8 | 251.1 | 20.0 | 76.2 |
| TACT | TransAct Technologies, Inc. | 12.14 | 3.0 | 90.7 | 20.2 | 59.8 |
| TAIT | Taitron Components, Inc. | 2.73 | 4.2 | 15.7 | 11.4 | 47.8 |
| TCEHY | Tencent Holdings Ltd. | 41.25 | 0.0 | 395,047.0 | 29.9 | 0.0 |
| TCS.TO | Tecsys Inc. | 15.13 | 1.5 | 193.2 | -189.1 | -274.2 |
| TCTZF | Tencent Holdings Ltd. | 41.45 | 0.0 | 395,900.7 | 30.0 | 0.0 |
| TCYSF | TECSYS, Inc. | 11.72 | 1.4 | 153.3 | -202.4 | -280.5 |
| TEL | TE Connectivity Ltd. | 92.81 | 1.9 | 31,178.1 | 9.9 | 18.9 |
| TER | Teradyne, Inc. | 60.95 | 0.6 | 10,014.9 | 23.0 | 14.1 |
| TESS | TESSCO Technologies, Inc. | 15.15 | 5.3 | 129.1 | 67.0 | 353.8 |
| TMICF | Trend Micro, Inc. | 46.50 | 3.1 | 6,462.2 | 25.2 | 78.5 |
| TOELF | Tokyo Electron Ltd. | 201.80 | 3.4 | 32,501.8 | 16.4 | 55.5 |
| TRUHF | Truly International Holdings Ltd. | 0.14 | 0.0 | 447.7 | 16.6 | 0.0 |
| TRUHY | Truly International Holdings Ltd. | 2.97 | 0.0 | 488.5 | 18.1 | 0.0 |
| TSM | Taiwan Semiconductor Manufacturing Co., Ltd. | 49.61 | 3.2 | 255,570.0 | 25.0 | 80.7 |
| TSYHF | TravelSky Technology Ltd. | 2.10 | 0.0 | 6,145.0 | 17.4 | 0.0 |
| TSYHY | TravelSky Technology Ltd. | 21.94 | 0.0 | 2,046.0 | 18.2 | 0.0 |
| TTCNF | Telit Communications Plc | 2.27 | 0.0 | 301.2 | 14.0 | 0.0 |
| TTDKF | TDK Corp. | 92.79 | 1.6 | 11,719.0 | 16.0 | 24.9 |
| TXN | Texas Instruments Incorporated | 129.46 | 2.3 | 120,866.4 | 23.2 | 52.6 |
| TYPE | Monotype Imaging Holdings, Inc. | 19.84 | 2.3 | 819.7 | 31.9 | 74.7 |
| UMC | United Microelectronics Corp. | 2.26 | 0.0 | 5,299.4 | 55.9 | 0.0 |
| VCM.TO | Vecima Networks Inc. | 9.60 | 2.4 | 212.5 | -60.0 | -144.6 |
| VNWTF | Vecima Networks, Inc. | 7.15 | 2.3 | 159.9 | -61.7 | -143.4 |
| VSH | Vishay Intertechnology, Inc. | 18.44 | 1.9 | 2,597.1 | 8.9 | 17.3 |
| VTKLF | VTech Holdings Ltd. | 8.85 | 7.5 | 2,224.9 | 13.0 | 98.0 |
| VTKLY | VTech Holdings Ltd. | 8.97 | 6.6 | 2,267.7 | 13.2 | 87.3 |
| WCAGY | Wirecard AG | 66.54 | 0.0 | 15,584.1 | 33.4 | 0.0 |
| WCRS | Western Capital Resources, Inc. | 3.60 | 5.6 | 33.8 | 170.6 | 947.9 |
| WDC | Western Digital Corp. | 58.13 | 3.4 | 17,278.7 | -22.5 | -77.2 |
| WIRE | Encore Wire Corp. (Delaware) | 57.06 | 0.1 | 1,192.9 | 14.9 | 2.1 |
| WIT | Wipro Ltd. | 3.78 | 0.0 | 22,836.4 | 17.3 | 0.0 |
| WNXDF | Diebold Nixdorf AG | 68.10 | 0.0 | 2,030.5 | 45.6 | 0.0 |
| WNXDY | Diebold Nixdorf AG | 13.03 | 0.0 | 1,942.5 | 43.6 | 0.0 |
| WRCDF | Wirecard AG | 133.43 | 0.0 | 15,185.0 | 33.5 | 0.0 |
| WSO | Watsco, Inc. | 174.48 | 3.6 | 6,595.7 | ||
| WSO.B | Watsco, Inc. | 171.66 | 3.6 | 6,533.3 | ||
| WSTG | Wayside Technology Group, Inc. | 14.49 | 4.7 | 65.3 | 10.2 | 48.1 |
| XLNX | Xilinx, Inc. | 94.34 | 1.5 | 23,830.8 | 25.4 | 39.0 |
| XPER | Xperi Corp. | 20.12 | 4.0 | 992.7 | 31.9 | 126.9 |
| XPPLF | XP Power Ltd. | 31.95 | 3.5 | 610.3 | 18.3 | 64.3 |
| XRX | Xerox Holdings Corp. | 29.80 | 3.4 | 6,594.3 | 13.1 | 44.1 |
| YAHOF | Z Holdings Corp. | 3.07 | 0.0 | 14,620.6 | 24.1 | 0.0 |
| YASKF | YASKAWA Electric Corp. | 33.09 | 1.4 | 8,663.9 | 40.5 | 58.4 |
| Ticker | Name | Price | Dividend Yield | Market Cap ($M) | P/E Ratio | Payout Ratio |
Keep reading this article to learn more about the benefits of investing in dividend-paying technology stocks. In addition to providing a full spreadsheet of tech stocks and how to use the spreadsheet, we give our top 10-ranked tech stocks today in terms of 5-year expected annual returns.
Table Of Contents
The following table of contents allows you to instantly jump to any section:
- How To Use The Tech Stocks List
- Why Invest In The Technology Sector?
-
The Top 10 Tech Stocks Today
#10: Corning (GLW)
#9: Intel (INTC)
#8: International Business Machines (IBM)
#7: NetApp (NTAP)
#6: Skyworks Solutions (SWKS)
#5: Xerox Holdings (XRX)
#4: HP Inc. (HPQ)
#3: Broadcom Inc. (AVGO)
#2: Salesforce Inc. (CRM)
#1: Micron Technology (MU)
How To Use The Technology Stocks List To Find Dividend Investment Ideas
Having an Excel document containing the names, tickers, and financial metrics for all dividend-paying technology stocks can be extremely powerful.
The document becomes significantly more powerful if the user has a working knowledge of Microsoft Excel.
With that in mind, this section will show you how to implement two actionable investing screens to the technology stocks list. The first screen that we’ll implement is for stocks with dividend yields above 3%.
Screen 1: High Dividend Yield Technology Stocks
Step 1: Download the technology stocks list at the link above.
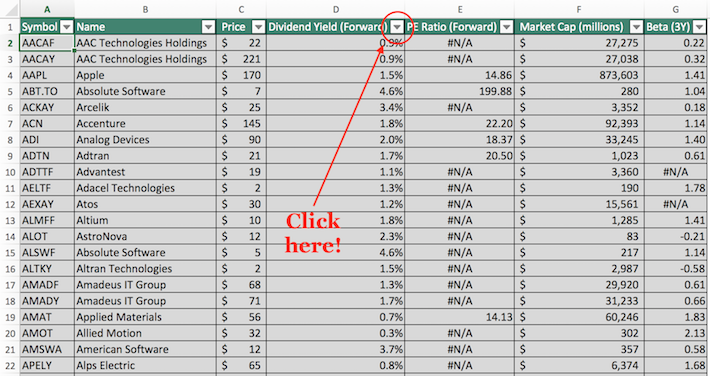
Step 2: Click on the filter icon at the top of the dividend yield column, as shown below.
Step 3: Change the filter setting to “Greater Than” and input 0.03 into the field beside it, as shown below.
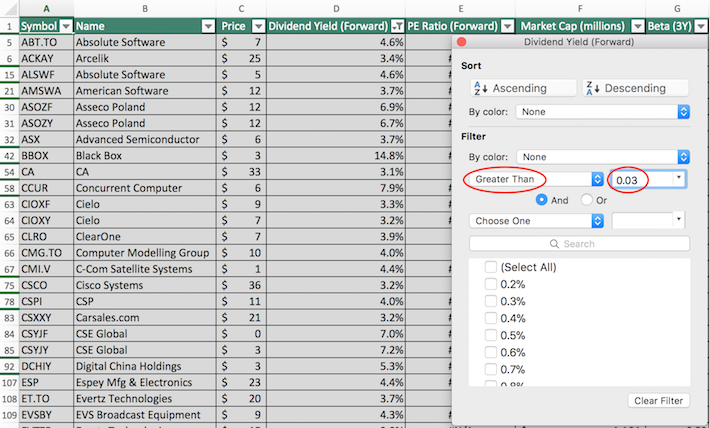
The remaining stocks in this spreadsheet are dividend-paying technology stocks with dividend yields above 3%, which provide a basket of securities that should appeal to retirees and other income-oriented investors.
The next section will show you how to simultaneously screen for stocks with price-to-earnings ratios below 20 and market capitalizations above $10 billion.
Screen 2: Low Price-to-Earnings Ratios, Large Market Capitalizations
Step 1: Download the technology stocks list at the link above.
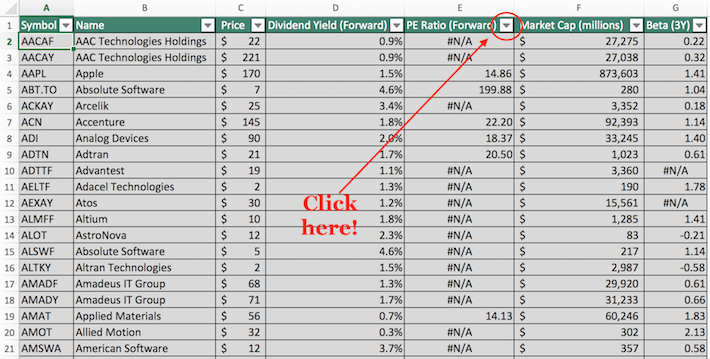
Step 2: Click on the filter icon at the top of the price-to-earnings ratio column, as shown below.
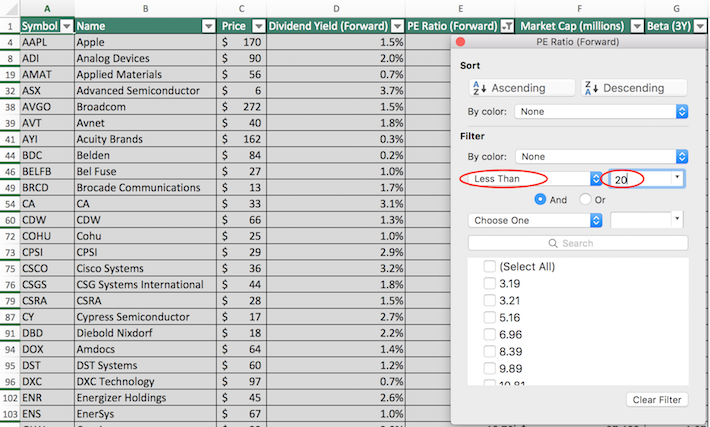
Step 3: Change the filter setting to “Less Than” and input 20 into the field beside it, as shown below.
Step 4: Exit out of the filter window (by clicking the exit button, not by clicking the Clear Filter button). Then, click on the filter icon at the top of the market capitalization button, as shown below.
Step 5: Change the filter setting to “Greater Than” and input 10000 into the field beside it, as shown below. Note that since market capitalization is measured in millions of dollars in this spreadsheet, inputting “$10,000 million” is equivalent to screening for stocks with market capitalizations above $10 billion.
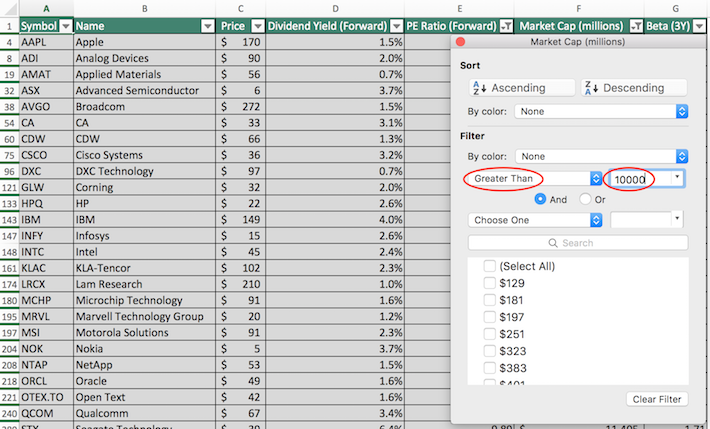
The remaining stocks in the Excel spreadsheet are dividend-paying technology stocks with price-to-earnings ratios below 20 and market capitalizations above $10 billion. The size and reasonable valuation of these businesses make this a useful screen for value-conscious, risk-averse investors.
Note: You can see the 10 biggest dividend paying technology stocks analyzed in detail here.
You now have an understanding of how to use the technology stocks list to find investments with certain financial characteristics. The remainder of this article will discuss the relative merits of investing in the technology sector.
Why Invest In The Technology Sector?
The technology industry is known for having some of the best-performing stocks over short periods of time. Indeed, it’s hard to overstate how much wealth was created for the early investors in companies like Facebook (FB), Microsoft (MSFT), or Apple (AAPL).
In addition, the technology sector is highly diversified. It includes everything from social media companies to semiconductor stocks. The technology sector itself is not a monolith; there are many types of businesses within the sector.
Unfortunately, the technology industry is also known for causing one of the most dramatic stock market bubbles on record. The 2000-2001 dot-com bubble destroyed billions of dollars of market value because technology stocks were trading at such irrationally high valuations.
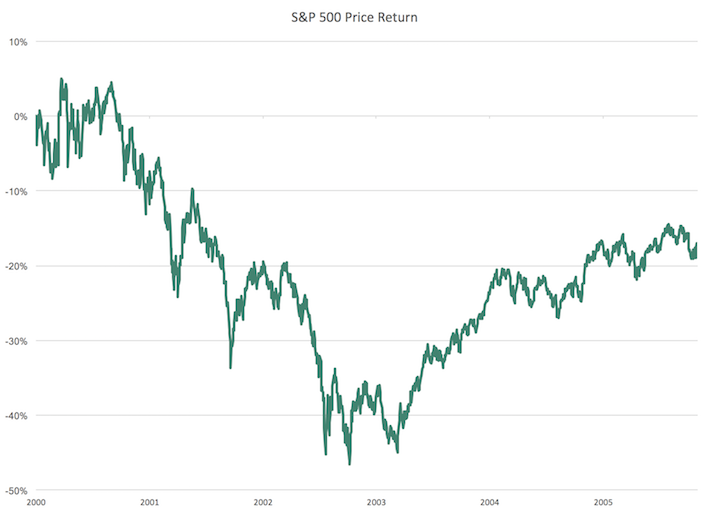
Source: YCharts
This notable bear market might lead some investors to avoid the technology sector entirely.
Fortunately, today’s technology sector is tremendously different from its predecessor in the early 2000s. While technology stocks were previously valued based on page views or other vanity metrics, this school of thought has changed significantly. Today’s technology stocks are valued based on the same yardsticks as other businesses: earnings, free cash flow, and, to a lesser extent, assets. Moreover, careful security analysis allows investors to find undervalued technology stocks and profits, just as with any other industry.
Investors might also avoid tech stocks because of a perceived inability to understand how they make money. Indeed, while many investors – most notably, Warren Buffett – ignore technology stocks because of their harder-to-understand business models, it’s important to note that not all technology stocks have business operations that are shrouded in complexity.
As an example, Apple has a very simple business model. The company manufactures and sells iPhones, Apple computers, and wearable devices. Moreover, one could argue that Apple’s greatest strength is not its technology, but its brand – similar to many non-technology companies like the Coca-Cola Company (KO), Procter & Gamble (PG), and Colgate-Palmolive (CL). Importantly, there are opportunities similar to Apple throughout the sector – not all technology stocks have competitive advantages that are based on microchip capacity or cloud computing speed.
The last reason why technology stocks can play an important role in your investment portfolio is that they have the potential to be very strong dividend stocks. Historically, the technology sector was devoid of any appealing dividend investments because technology firms reinvested all money to drive rapid organic growth. This is no longer the case, at least not in general. Many technology firms now pay steadily rising dividends year in and year out.
As an example, this article from CNBC describes how information technology companies have been the largest contributor to historical dividend growth over the last several years. Moreover, there are plenty of individual technology companies with very strong dividend growth rates. Two examples are:
- Apple: 10.7% 5-year dividend growth rate
- Microsoft: 12.8% 5-year dividend growth rate
The profits of these large, stable technology companies are only growing. And, many technology firms have fairly low payout ratios. These factors lead us to believe that the technology sector will continue to provide strong dividend growth investment opportunities for the foreseeable future.
The Top 10 Tech Stocks Today
With all that said, the following 10 stocks represent our highest-ranked tech stocks in the Sure Analysis Research Database, in terms of 5-year expected annual returns. Rankings are listed in order of expected total annual returns, in order from lowest to highest.
Tech Stock #10: Corning (GLW)
- 5-Year Annual Expected Returns: 9.2%
Corning operates in five segments: Display Technologies, Optical Communications, Specialty Materials, Environmental Technologies, and Life Sciences. The $22 billion market cap company generates over $1.5 billion in annual core earnings.
On July 30th, Corning released second-quarter results. Corning reported $2.99 billion in core sales, representing an 8% year-over-year increase compared to Q2 2018, as four of the company’s five segments posted double-digit growth. Core earnings came in at $410 million, a 14% increase, while core earnings-per-share increased 18%. Environmental Technologies was the strongest performer for Corning last quarter.
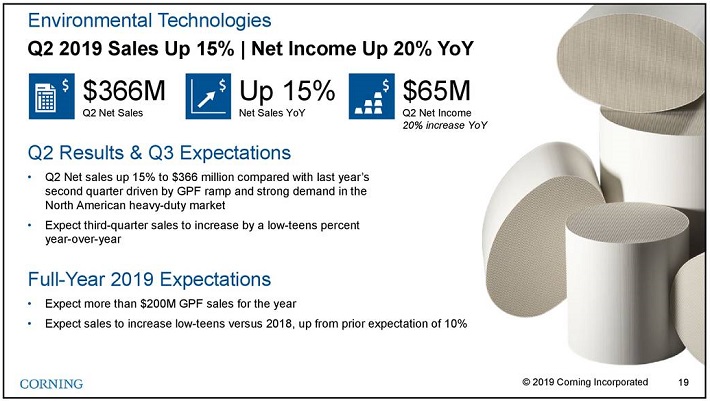
Source: Earnings Slides
Corning also updated its full-year 2019 outlook. Display Technologies and Optical Communications sales are anticipated to grow by a low-to-mid single digit percentage, while Environmental Technologies is expected to grow by over 10% to lead the company’s growth.
Corning has strong growth prospects ahead. The company enjoys a leading position in fiber-optic cables, LCD’s, screens, and specialty glass. Smart phone glass will continue to be an important part of the business, but increased optical fiber usage from areas like the Internet of Things, 5G mobile technology and autonomous driving could also drive future growth. Share repurchases will also help boost earnings-per-share growth, as Corning has approved a $5 billion share buyback program.
Corning stock has a price-to-earnings ratio of 14.8, which is just below our fair value P/E estimate of 15. Therefore, valuation changes will only add 0.4% to Corning’s annual returns. Total returns will be based primarily from expected EPS growth (6%) and the 2.8% dividend yield, producing total expected returns of 9.2% per year through 2024.
Tech Stock #9: Intel Corp. (INTC)
- 5-Year Annual Expected Returns: 10.0%
Intel is the largest manufacturer of microprocessors in the world. The company ships about 85% of the world’s microprocessors. Intel also manufactures products like servers and storage devices that are used in cloud computing. Intel generates annual revenue above $69 billion and the stock has a current market capitalization of $225 billion.
Intel released financial results for the second quarter on July 25th. The company earned $0.92 per share, which was $0.08 higher than analysts had expected, but represented a 13.4% decrease from the previous year. Revenue declined 2.7% to $16.5 billion, but topped estimates by $825 million.
Overall, the data-centric businesses declined 7% year-over-year. Revenues for Data Center decreased 10% to $5 billion. Declines in cloud and government revenue more than offset a 3% gain in the communications service provider business.
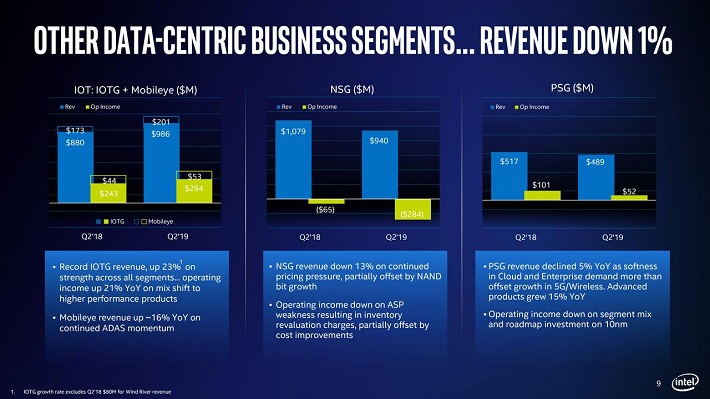
Source: Earnings Slides
Going forward, we expect 5% annual EPS growth for Intel. Revenue growth will be fueled by new growth areas such as the Internet of Things, or IoT. Intel has a big lead in this emerging growth segment, as its Internet of Things Group grew revenue by 12% to nearly $1 billion last quarter.
Separately, Intel’s $15 billion acquisition of Mobileye is a growth catalyst. Mobileye’s revenue was a record $201 million, an improvement of 16% from the previous year.
Intel stock trades with a 2019 P/E ratio of 11.5, compared with our target P/E of 13 which we believe to be fair value for a highly profitable industry leader. Expansion of the P/E ratio could boost annual returns by 2.5% annually over the next five years.
Intel stock also has a current dividend yield of 2.5% right now. Combined with annual EPS growth estimates of 5%, Intel stock has a total expected return of 10% annually through 2024.
Tech Stock #8: International Business Machines (IBM)
- 5-Year Annual Expected Returns: 10.6%
IBM is a global giant with $80 billion in 2018 revenue, while the stock has a market capitalization of ~$127 billion. The company has five business segments: Cloud & Cognitive Software, Global Business Services, Global Technology Services, Systems, and Global Financing.
IBM reported mixed fiscal third-quarter results. Revenue of $18 billion declined 3.9% year-over-year, but a more modest 0.6% when excluding divested businesses and currency. Positively impacting results last quarter were Cloud & Cognitive Software, up 8%, and Global Business Services which rose 2% on an organic basis.
Revenue from the recently-acquired Red Hat increased 20% accounting for currency. On July 9th, IBM announced it closed on its $34 billion acquisition of Red Hat Inc. to boost its cloud platform.
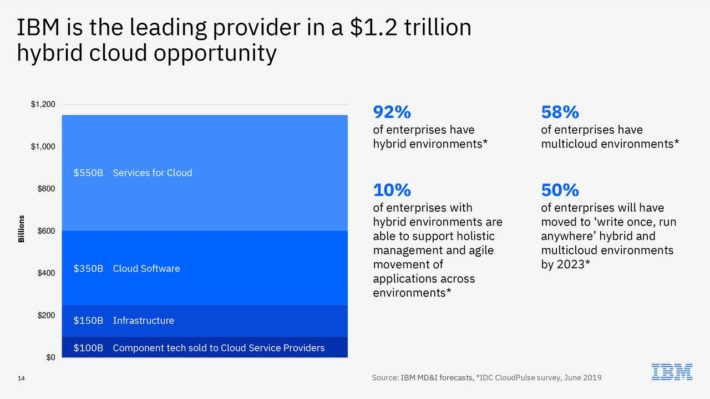
Source: Investor Presentation
Red Hat generates annual revenue of about $3 billion and operates in the open-source software market, primarily distributing technology products used in data centers.
IBM’s strategic initiatives will generate the company’s future growth. For example, total cloud revenue increased 14% to $5 billion last quarter, and has now totaled $20 billion in revenue over the past 12 months, with more to come from Red Hat. We expect 3% annual earnings growth through 2024.
Based on expected earnings-per-share of $13.90 for 2019, IBM stock holds a price-to-earnings ratio of 10.3. Our fair value estimate for IBM is a price-to-earnings ratio of 12.0, a slight discount to its average price-to-earnings ratio over the past 10 years. If its stock valuation increases to the fair value estimate, it would generate annual returns of 3.1% if it occurs over a 5-year period.
In addition, 3% expected annual earnings growth and the 4.5% dividend yield bring total expected returns to 10.6% per year over the next five years.
Tech Stock #7: NetApp (NTAP)
- 5-Year Annual Expected Returns: 11.7%
NetApp Inc. calls itself the “data authority for hybrid cloud” providing services to simplify and empower a company’s use of its data. Last year, products made up 59% of the company’s revenues, software maintenance accounted for 16% of revenues, and hardware maintenance and other services equaled the remaining 25%.
The $13 billion market cap company is expected to generate over $6 billion in sales this year and earn over $1 billion in net income. On August 14th, NetApp released Q1 fiscal year 2020 results for the period ending July 26th, 2019.
For the quarter the company reported net revenue of $1.24 billion, compared to $1.47 billion in Q1 of fiscal 2019 and below prior guidance of $1.315 billion to $1.465 billion. Top line results were especially weak, as $90 million of enterprise software license agreements from the year-ago period did not repeat this quarter.
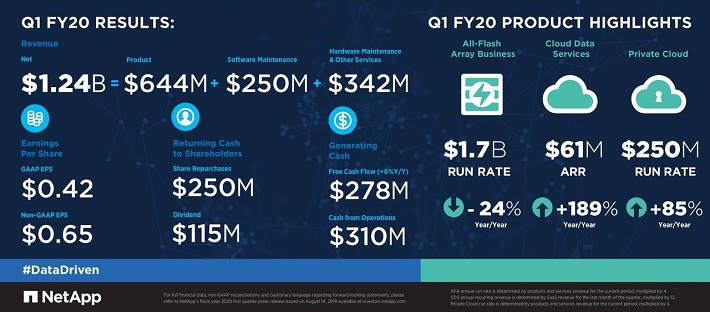
Source: Earnings Slides
Adjusted net income came in at $157 million or $0.65 per share, below $1.04 in Q1 fiscal year 2019 and its own prior guidance of $0.78 to $0.86.
The company has multiple growth opportunities, as businesses migrate to public and private clouds. Moreover, increased spend in the industry related to upgrading to faster, higher capacity and more efficient storage solutions ought to bode well for the business, especially in the short-term.
However, NetApp operates in an industry with large storage competitors. Further, NetApp’s legacy network storage business is in decline.
That said, NetApp stock appears to be undervalued. The stock trades for a P/E ratio of 13.5, compared with our fair value estimate of 15. A higher valuation multiple could boost annual returns by 2.1% per year through 2024. In addition, we expect 6% annual EPS growth, and the stock has a 3.6% dividend yield for total expected returns of 11.7% per year.
Tech Stock #6: Skyworks Solutions (SWKS)
- 5-Year Annual Expected Returns: 12.5%
Skyworks Solutions is a semiconductor company that designs, develops, and markets proprietary semiconductor products used around the world. Its products include antenna tuners, amplifiers, converters, modulators, receivers, switches, and more.
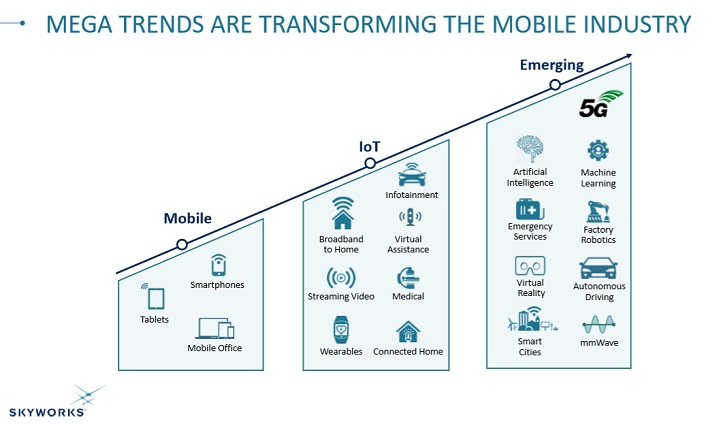
Source: Investor Presentation
Skyworks’ products are used in a diverse range of industries, including automotive, connected home, industrial, medical, smartphones, and defense. Skyworks has a market capitalization of $14 billion.
On August 7th, Skyworks reported third quarter results. The company reported $0.83 in diluted GAAP EPS, which was down from $1.57 from the same period last year. On a non-GAAP basis, the company reported $1.35 in diluted EPS for the quarter.
Revenue declined 14% from the same period last year. Ongoing global uncertainty and a slowing growth rate of its primary customer, Apple Inc. (AAPL), are contributing to Skyworks’ challenged results.
However, the company raised its quarterly dividend 16% from $0.38 to $0.44 per share, and also cited strong confidence and cash flows in the core business despite external volatility in the industry. The company gave midpoint guidance of $1.50 in non-GAAP diluted EPS for the fourth quarter.
Skyworks has enjoyed tremendous growth over the past decade, thanks to the proliferation of smart phones that use its chips—in particular the iPhone. The company increased its EPS by 27% per year over the past 10 years, and by approximately 20% over the past five years.
However, analysts expect earnings to decline through 2019 and for sluggish growth over the next couple of years. The global semiconductor market is in a severe downturn, and smartphone growth has flatlined. Overall, we expect 9% annual EPS growth through 2024.
Skyworks stock trades for a P/E ratio of 13.2. We consider a P/E ratio of approximately 14 to be fair, at least until the company can demonstrate a wider customer base and diversify away from its smart phone focus. Still, an expanding valuation multiple could boost annual returns by 1.2% per year.
In addition, expected EPS growth of 9% annually plus the 2.3% dividend yield result in total expected returns of 12.5% per year through 2024.
Tech Stock #5: Xerox Holdings Corp. (XRX)
- 5-Year Annual Expected Returns: 12.7%
Xerox Corporation traces its lineage back to 1906. Through a series of mergers and spinoffs, the Xerox we know today was formed. Xerox spun off its business processing unit last year (now called Conduent) and now focuses on design, development and sales of document management systems. The company produces $9+ billion in annual revenue and has a market capitalization of nearly $7 billion.
Xerox reported mixed second-quarter earnings. Total revenue declined 7.2% against the year-ago period on an adjusted constant currency basis. Equipment sales fell 10.2%, while Post-Sale revenue declined 8.4%.
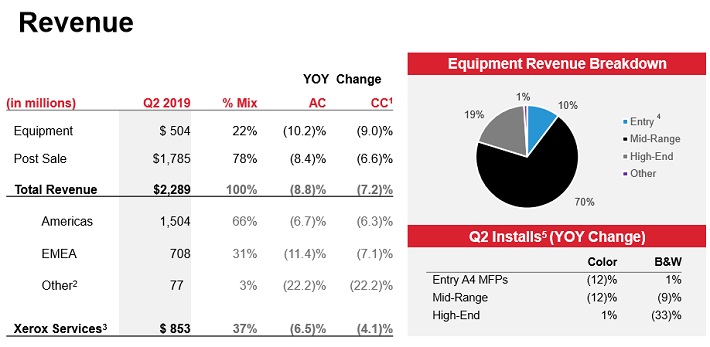
Source: Earnings Slides
Adjusted earnings-per-share rose from $0.80 in the year-ago period to $0.99 in Q2 thanks to cost savings and a lower share count. Xerox reiterated earnings-per-share guidance at $3.80 to $3.95 after Q2.
Xerox has been focused on its Project Own It, the company’s enterprise-wide initiative to simplify its operations, drive continuous improvement, and free up capital to reinvest in future growth. It expects this program to drive at least $640 million in cost savings this year.
Xerox is not a high-growth business, as the company is still moving beyond its hardware-based past. However, it is a highly profitable company, which means it can return cash to shareholders via buybacks and dividends. The company intends to buy back ~$600 million of its own shares in 2019, and the stock has a current dividend yield of 3.3%.
Xerox trades for a P/E ratio of 7.8, based on expected 2019 EPS of $3.88. Our fair value estimate is a P/E ratio of 11, meaning an expanding valuation could boost annual returns by 7.1% per year through 2024. In addition to 2.5% expected annual EPS growth and the 3.3% dividend yield, total returns could reach 12.9% per year.
Tech Stock #4: HP Inc. (HPQ)
- 5-Year Annual Expected Returns: 13.0%
HP Inc. is the result of Hewlett-Packard spinning off its enterprise technology infrastructure, software and services business, known as Hewlett Packard Enterprise Company (HPE). After the spin-off, HP Inc. now creates technology mainly in two segments: its portfolio of printers and through personal systems (computers and mobile devices). HP Inc. generated $59 billion in revenue last year, and the stock has a market capitalization of $28 billion.
HP reported its third quarter (fiscal 2019) results on August 22. The company reported revenue of $14.6 billion for the quarter, which was slightly more than what the analyst community had forecasted, and up marginally from the previous year’s quarter. Currency rates were a headwind, organic revenues (adjusted for forex movements) were up 2% year over year, which is a decent growth rate for the company. Non-GAAP earnings-per-share totaled $0.58 per share during the quarter, which easily beat the analyst consensus estimate. Earnings-per-share were up by a solid 12% versus the prior year’s quarter.
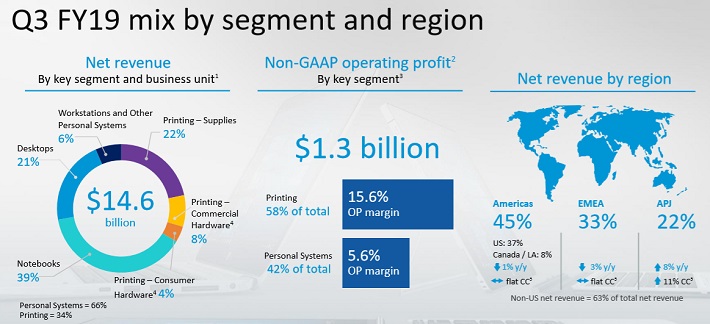
Source: Earnings Slides
HP Inc. provided an updated outlook for Q4 during the Q3 earnings release. The company anticipates non-GAAP diluted earnings-per-share of $0.55 to $0.59 for Q4 2019, which would result in earnings-per-share of $2.20, for the current year, using management’s midpoint of the fourth quarter guidance range. This would equate to a year-over-year earnings-per-share growth rate of close to 10% versus fiscal 2018, which would be a solid result for the company. During the third quarter HP continued to reward shareholders handsomely, paying out $800 million via dividends and share repurchases.
HP is a leader in its printing and personal computing markets, but these are areas that face challenges as consumers continue to shift to mobile devices. The adoption of 3D printing could help, as HP is already entrenched in this industry, but so far, the majority of profits are generated by traditional printers and printing products. Through a low revenue growth rate, and a solid pace of share repurchases, we expect ~5.8% annual EPS growth through 2024.
HP stock trades for a P/E ratio of 8.7, below our fair value estimate of 10.5. An expanding valuation could add 3.8% to HP’s annual returns. Combined with expected EPS growth and the 3.4% dividend yield, HP’s annual returns could reach 13% per year through 2024.
Tech Stock #3: Broadcom Inc. (AVGO)
- 5-Year Annual Expected Returns: 13.1%
Broadcom designs, develops and sells semiconductors under the following business units: Wired infrastructure, wireless communication, enterprise storage and industrial. Its offerings include data center chips, factory automation, energy systems and power generation, broadband access, and home connectivity.
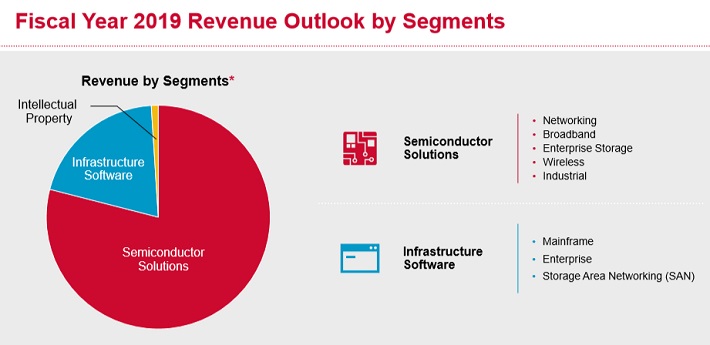
Source: Investor Presentation
Broadcom is a fabless semiconductor company, which means that the products it designs are manufactured by other companies (so-called foundries). Broadcom stock has a market capitalization of $110 billion.
Broadcom reported its fiscal third quarter earnings results on September 12th. The company generated revenues of $5.52 billion during the quarter, which represents an increase of 9.1% compared to the prior year’s quarter. Broadcom reported earnings-per-share of $5.16 for the third quarter, up 4% year-over-year.
The company forecasts revenues of $22.5 billion, implying a revenue growth rate of 8% versus 2018. Revenue guidance includes the impact of the acquisition of CA Technologies, which closed in late 2018.
Broadcom’s profitability has exploded over the last decade. Indeed, its earnings-per-share rose more than tenfold between 2010 and 2018. This earnings growth was driven by a significant amount of M&A, the most important one being the merger between Broadcom and Avago Technologies.
Broadcom has since made several other major takeovers, including its acquisition of Brocade for $6 billion that closed in late 2017, and its takeover of CA that closed in late 2018.
By moving towards acquisitions in the software industry with its CA takeover, Broadcom has found a new way of generating inorganic growth. Broadcom’s biggest market is wireless communication, where the company owns a strong connectivity portfolio that includes advanced LTE, Bluetooth 5.x, Wi-Fi, GNSS (GPS, Galileo, etc.), and more.
Broadcom is also well-positioned in the enterprise storage market, where it provides switching and other connectivity solutions and storage products such as SSD controllers.
These markets will continue to grow, and even without any major acquisitions, Broadcom’s revenues should continue to grow as well. The combination of acquisitions and organic growth should result in solid revenue growth and increasing tailwinds from improving economics of scale, while buybacks positively impact growth as well. We anticipate 9% annual EPS growth through 2024.
Broadcom stock trades for a P/E ratio of 12.9, close to our fair value estimate of 13. Expansion of the P/E ratio will only slightly add to returns, by 0.2% per year through 2024. Earnings growth and the 3.9% dividend yield will account for the bulk of shareholder returns. Total returns are expected to reach 13.1% per year over the next five years.
Tech Stock #2: Salesforce Inc. (CRM)
- 5-Year Annual Expected Returns: 13.5%
Salesforce is a customer relationship management technology company that provides tools for companies to improve their relationships with clients. The company provides a cloud platform for companies to manage contracts, customer interactions, requests, and contacts.
Salesforce has been among the S&P 500 Index’s strongest growth companies over the past several years.
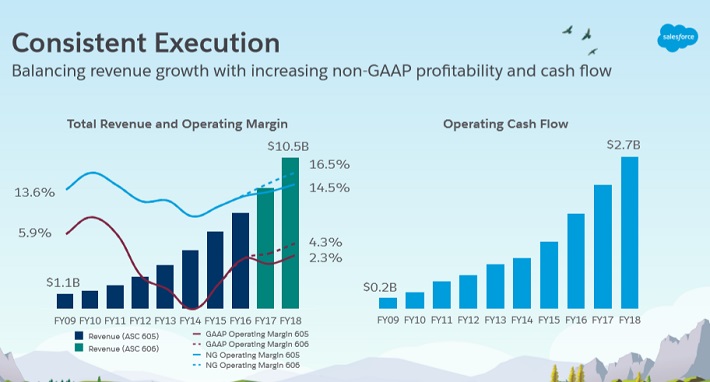
Source: Investor Presentation
The company currently has a market capitalization of $115 billion, and the company generates in excess of $16 billion of annual revenue. Salesforce reported Q2 earnings on 8/22/19 and results were once again outstanding, including a guidance raise. Revenue grew 23% in constant currency, to $4 billion. Subscription and support revenue increased 22% year-over-year. In addition, professional services revenue increased 14%.
Salesforce does not pay a dividend as it’s spending heavily on sales growth and new technology development in the fields of artificial intelligence, automation and the Internet of Things. But its growth investments have clearly worked to the benefit of shareholders, as the company has more than doubled its revenue-per-share in the past five years.
We expect 20% annual growth through 2024. On a valuation basis, the stock trades for a price-to-sales ratio of 7 based on 2019 expected revenue. We value growth stocks like Salesforce by price-to-sales instead of price-to-earnings, as the company’s EPS is highly volatile from year to year. Our fair value P/S ratio is 5, which indicates the stock is overvalued.
If the P/S ratio contracts to the fair value estimate, shareholder returns would be reduced by 6.5% per year through 2024. However, such a high rate of expected growth (20% annually) means total returns are still expected to reach 13.5% annually through 2024.
Tech Stock #1: Micron Technology (MU)
- 5-Year Annual Expected Returns: 14.4%
Micron Technology Inc is one of the top three producers of DRAM in the world, as well as one of the world’s top six NAND producers. DRAM refers to volatile dynamic random-access memory that computers, servers, smartphones, and embedded devices use to operate. NAND refers to non-volatile flash memory that serves as data storage for all these devices. With a market capitalization of $48 billion, Micron produced approximately $30 billion in revenue in 2018.
On September 27th, Micron reported fiscal fourth-quarter financial results including weak guidance. Revenue of $4.9 billion declined 42% but did beat expectations by $310 million. Adjusted EPS of $0.56 also beat expectations, by $0.08 per share. Micron saw particularly strong growth in SSDs and Automotive segment sales last quarter. However, the company lowered its outlook for DRAM sales for the full year.
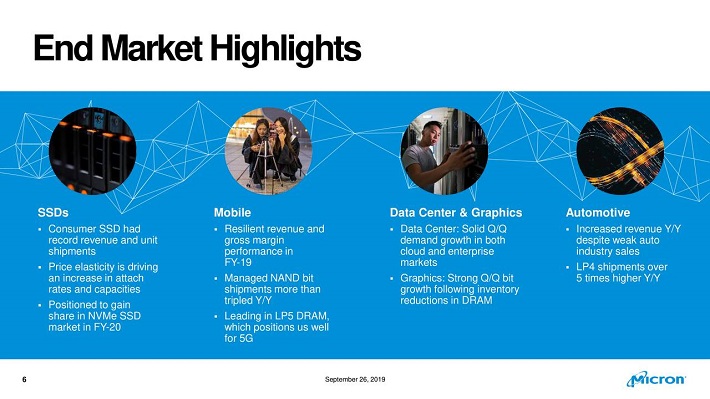
Source: Earnings Slides
The major point of uncertainty for Micron is the situation with Huawei. Sales to Huawei declined sequentially last quarter and were even below what the company had expected before the U.S. ban took place. The company has applied for waivers with the government, but if those are not granted, future results could be negatively impacted.
Still, we estimate 15% annual EPS growth over the next five years from consensus 2019 EPS estimates, although the actual growth rate will be highly variable depending on how the current semiconductor pricing cycle plays out and subject to potential political tail risks involving ongoing international trade disputes.
Based on expected EPS of $5.99, Micron stock trades for a P/E ratio of 7.2. Our fair value estimate is a P/E ratio of 7, meaning the stock is slightly overvalued. A declining valuation could reduce annual returns by 0.6% per year over the next five years However, expected annual EPS growth of 15% could lead to total annual returns of 14.4% per year through 2024.
Final Thoughts
The technology sector has become an intriguing place to look for high-quality dividend investment opportunities.
With that said, it is not the only place to look for investment ideas.
If you’re willing to venture outside of the technology sector, the following databases contain some of the most high-quality dividend stocks around:
- The Dividend Aristocrats List: Dividend stocks with 25+ years of consecutive dividend increases
- The Dividend Achievers List: Dividend stocks with 10+ years of consecutive dividend increases
- The Dividend Kings List: Dividend stocks with 50+ years of consecutive dividend increases
- The Blue Chip Stocks List: Dividend stocks with 3%+ dividend yields and 100+ year operating histories