


Updated on November 15th, 2019 by Bob Ciura
The four money center banks in the U.S. have received a great deal of attention from investors and the media in the years since the Great Recession. The big banks suffered mightily during the worst economic downturn in decades.
However, those days have long since passed, and the largest banks are generating profits at rates never seen before.
Many big banks have fully recovered and then some, and have returned to paying hefty dividends to shareholders. You can download the full list of all 1,000+ dividend paying financial sector stocks below.
In addition, these once-strong dividend stocks were reduced to smaller payouts for years, but are in the process of restoring those shareholder distributions; some have made better progress than others.
However, the past decade has rejuvenated the group and in this article, we’ll rank them in order of attractiveness on a total return basis, as derived from our Sure Analysis database.
Table Of Contents
You can use the following table of contents to instantly jump to a specific stock:
Rankings are compiled based upon the combination of current dividend yield, expected change in valuation as well as forecast earnings-per-share growth to determine which stocks offer the best total return potential for shareholders over the next five years.
The 4 big bank stocks are ranked in order of expected 5-year annual returns, in order from lowest to highest.
Big U.S. Bank #4: JPMorgan Chase & Company (JPM)
JPMorgan Chase traces its lineage back to 1799, making it one of the oldest surviving banks in the U.S. The company has a strong global reach in consumer and community banking, commercial and investment banking, as well as asset and wealth management.
It is the product of more than 1,200 different entities that have merged in the 220 years since its creation and is the largest bank in the U.S. by market capitalization, with annual revenue of $115 billion and a market capitalization above $400 billion.
JPMorgan is one of over 20 mega-cap stocks, which are stocks with market capitalizations above $200 billion.
JPMorgan competes in every major segment of financial services, including consumer banking, commercial banking, home lending, credit cards, asset management and investment banking. The company reported third-quarter earnings on 10/15/19 and results were strong once again. Earnings-per-share came to $2.68 in Q3, an increase of 4.7% from $2.34 in the year-ago period. JPMorgan saw strength in fee and interest-generating assets as volumes from home lending and credit cards contributed.
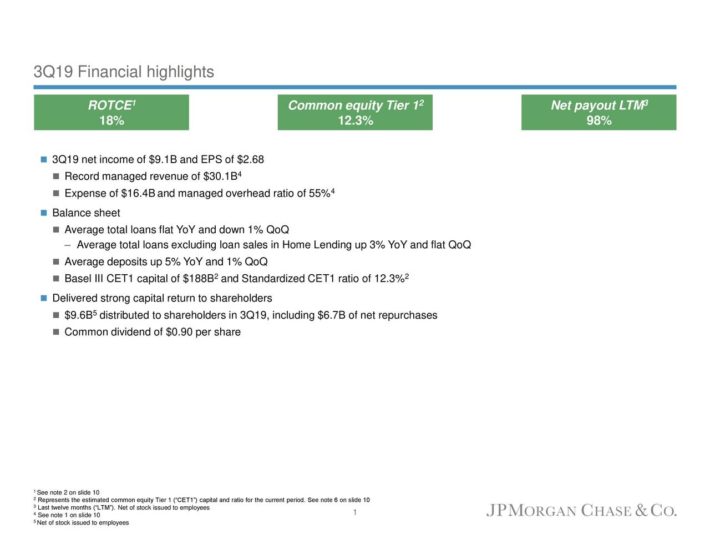
Source: Earnings Slides
Net interest income was up $300 million year-over-year to $14.4 billion, but credit costs were up $600 million from last year’s Q3 to $1.5 billion. The bank’s core consumer banking segment saw its net income rise $187 million year-over-year to $4.27 billion. Corporate and investment banking net income was up $183 million year-over-year to $2.81 billion.
Commercial banking net income was down significantly, falling from $152 million year-over-year to $937 million. Asset management net income was down as well, declining $56 million to $668 million from last year’s Q3. JPMorgan’s efficiency ratio came in at 55% during Q3, which was among with the most efficient of its peers.
JPMorgan’s balance sheet remains in excellent shape as its supplementary leverage ratio is 6.3% and its common equity tier 1 ratio is 12.3%, which are both among the highest of the nation’s large banks. The company also distributed $9.6 billion to shareholders in Q3, $2.9 billion of which was the dividend, and the balance through share repurchases.
JPMorgan is a strong dividend growth stock, with a 2.8% dividend yield and a recent 12.5% dividend increase. However, we view the stock as slightly overvalued, which we expect will have a negative impact of 3.2% per year over the next five years. Expected earnings-per-share growth of 5.5% is expected to contribute positively, leading to total annual returns of % per year through 2024.
Big U.S. Bank #3: Bank of America (BAC)
Bank of America was founded back in 1904 and since then, has grown into a global banking juggernaut. It has built a strong presence in credit cards, consumer and commercial lending, wealth management, and other financial services. The market capitalization is $296 billion today, making it the second-largest bank in the U.S.
Bank of America reported strong third-quarter earnings. Earnings-per-share came in at $0.75, well in excess of estimates at $0.68, and up from $0.66 in the year-ago quarter. Net interest income was $12.2 billion in Q3, up slightly from the year-ago period, and equal with Q2. Net interest yield came to 2.41%, which was a small decline against the year-ago period. Consumer banking net income was up 5% to $3.3 billion as loans increased 7% to $304 billion, while deposits were up 3% to $709 billion.
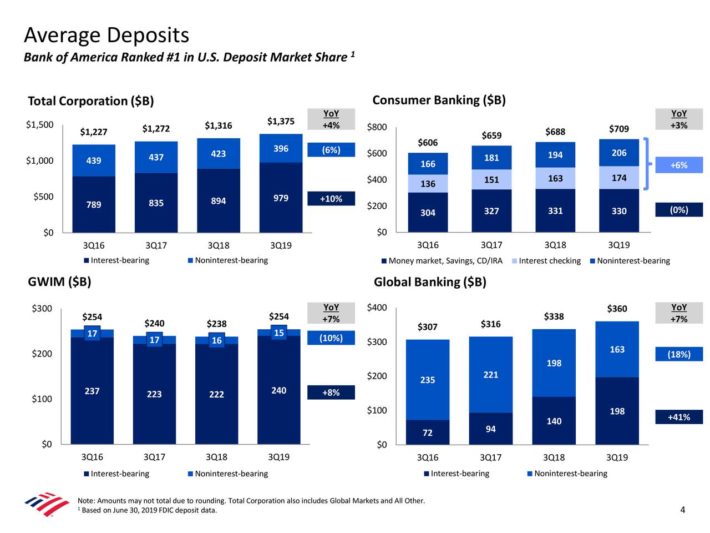
Source: Earnings presentation
Global wealth and investment management net income was up 8% year-over-year to $1.1 billion as loans increased 5%, more than offset by a 7% increase in deposits. Global banking net income rose 3% to $2.1 billion as loans were up 7%, and deposits rose by the same amount. Finally, global markets income fell 8% year-over-year to $0.8 billion as equities revenue was a bright spot, but sales and trading weakness more than offset it. In total, revenue net of interest expense was up slightly to $22.8 billion.
Provisions for credit losses came to $779 million and adjusted noninterest expense was essentially flat at $13.1 billion. Net charge-offs came to 0.34%, compared to 0.40% in last year’s Q3 as credit quality continues to improve. Average loans and leases were up 6% while deposits rose 4% in total to $1.4 trillion. Book value per share was up 11% to $26.96, while tangible book value is now $19.26 per share. The bank returned $9.3 billion to shareholders during the quarter through a combination of dividends and share repurchases.
The bank’s efficiency ratio remained at 57% in Q3 after spending years in the mid-60s or higher. If this trend continues, Bank of America’s earnings growth will remain higher than the company’s revenue growth rate. Bank of America also continues to buy back shares, which is a tailwind for its earnings-per-share growth rate as the float shrinks. Continued dividend increases are also likely, as the company has an expected payout ratio below 30% for 2019.
We expect Bank of America to return nearly 7% to shareholders annually for the next five years, consisting of 6% expected annual EPS growth and the 2.2% dividend yield, partially offset by a small reduction in the stock valuation as shares have rallied ~33% year-to-date.
Big U.S. Bank #2: Wells Fargo & Company (WFC)
Wells Fargo was founded in 1852. Today, it provides banking, investments, mortgages, as well as consumer and commercial financing products through more than 8,000 locations in 42 countries.
Wells Fargo has $2 trillion in assets, and produces nearly $85 billion in annual revenue. Wells Fargo’s market capitalization is $215 billion, which makes it the third-largest bank in the U.S.
Wells Fargo reported Q3 earnings on 10/15/19 and results were somewhat weak.
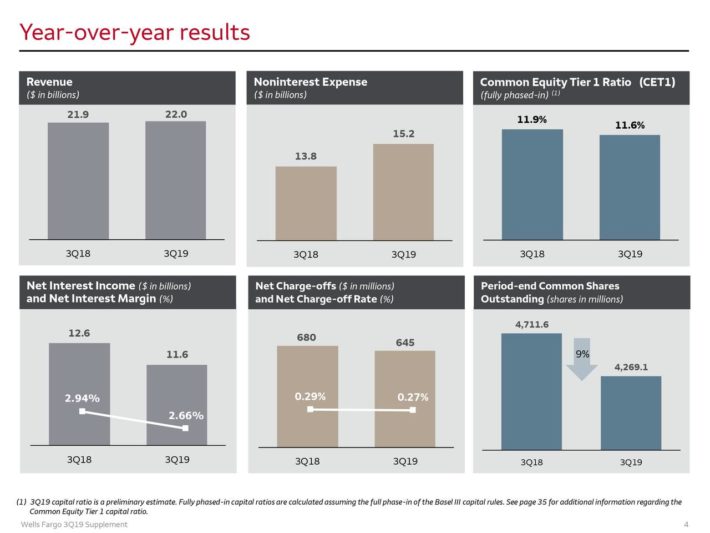
Source: Earnings presentation, page 4
The recent, sharp moves lower in long-term rates have significantly hurt the bank’s ability to generate interest income. Net interest income, or NII, fell nearly half a billion dollars from the previous quarter, to $11.6 billion. Wells Fargo suffered from balance sheet repricing due to yield curve inversion, as well as higher mortgage-backed securities premium amortization. These factors were partially offset by an additional selling day during the quarter and favorable balance sheet growth and mix. However, it has become clear that Wells Fargo is struggling with the current interest rate environment.
Net interest margin, or NIM, declined 16 basis points to 2.66% from the previous quarter. It was down from 2.94% in the comparable period last year. Given Wells Fargo’s heavy exposure to traditional lending, the inversion of the yield curve was a meaningful challenge. Still, credit quality remains strong as net charge-offs were just 0.27% of average total loans last quarter, largely in-line with recent periods.
Average loans were up fractionally in the third quarter to $950 billion as commercial loans were flat but consumer loans increased slightly. Average deposits were up $22 billion to $1.3 trillion as commercial and retail deposits both performed well. Average deposit cost, however, was 71 basis points, up enormously from last year’s third-quarter value of 24bps. Wells Fargo has been running promotional rates and offers, and while it is attracting deposits, it is doing so at a high cost. Earnings-per-share came to $0.92, down 10% from EPS of $1.13 in last year’s third-quarter.
Despite the challenging quarter, we view Wells Fargo stock attractively thanks to its high dividend yield of 3.8%, and expected EPS growth of 5% per year. A very small boost from valuation expansion brings our total expected returns to nearly 9% per year over the next five years for Wells Fargo stock.
While Wells Fargo certainly has some issues to work out operationally, we see the stock as cheap and with a large dividend yield, which is the highest among the large banks today.
Big U.S. Bank #1: Citigroup (C)
Citigroup has been in the banking business since 1812, when it was known as the City Bank of New York. This humble beginning eventually gave way to a global powerhouse with interests in credit cards, commercial banking, trading, and a variety of related activities.
It has thousands of branches all over the world and a $161 billion market capitalization today, making it the smallest of the big banks in this article.
Citigroup certainly had the farthest to come in terms of recovering from the 2008 financial crisis. The stock famously fell below $1 briefly during the worst of the recession, but the eventual bailout and years of economic growth have paid off for the company.
Citigroup is in much better shape than it has been in recent years. Indeed, its recently reported Q3 results showed it continues to make progress towards its goals of a strong balance sheet and a balanced outlook for growth and risk.
Total revenue was up 1% year-over-year, driven by a 3% gain in Institutional Clients revenue and flat Global Consumer Banking revenue. Expenses were up 1% as Citi’s efficiency ratio came to 56.3% in Q3, which is roughly in-line with other recent periods, as well as Citi’s money center bank competitors. Total cost of credit was up 6% in Q3 as net credit losses rose 9%, but that was partially offset by a credit reserve release.
Operating income was down 1% year-over-year thanks to these factors. Citi’s provision for income taxes fell 27% thanks to a lower effective rate, which saw income after taxes rise 7%. Net income rose nearly 20% to $2.07 per share in Q3.
Global consumer banking trends remain healthy for Citigroup, and supportive of future growth.
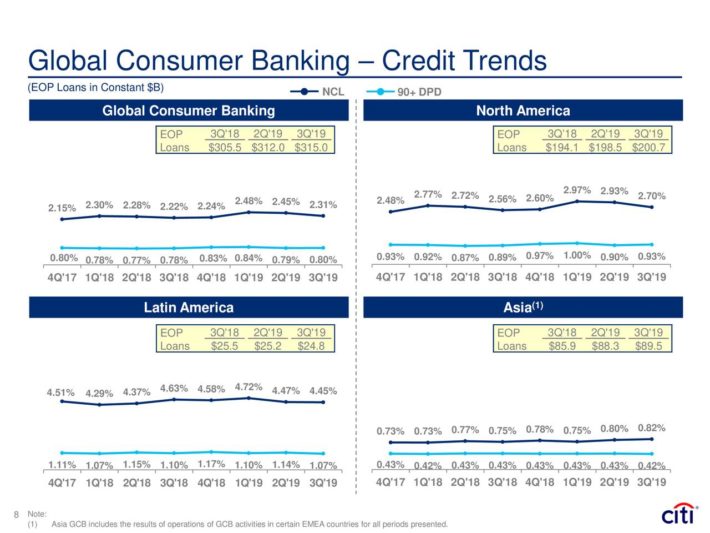
Source: Earnings presentation
Citi bought back 76 million shares in Q3 as part of its years-long capital return program, in addition to a recent dividend increase to a $2.04 annualized payout. Total assets rose 5% year-over-year in Q3, while loans were up 2% and deposits rose 8%. Citi’s loan-to-deposit ratio was just 64% in Q3, leaving ample room for continued earning-asset growth.
The bank’s capital ratios remain in excellent shape despite tens of billions of dollars of capital returns in recent years. Citi’s common equity tier 1 ratio is 11.6%, essentially flat with last year. Its supplementary leverage ratio is 6.3%, down fractionally from last year’s 6.5%. Book value rose 11% year-over-year and tangible book value per share gained 12% to $69.03 from the year-ago period. After the strong Q3 result, we’ve boosted our earnings-per-share estimate for this year from $7.50 to $7.70.
Citi’s earnings-per-share history is clouded by the immense struggles it endured following the Great Recession. However, years of hard work have paid off, and earnings have continued to move higher over time. We see Citi producing $7.70 per share in 2019 and robust growth of 8.0% annually thereafter, fueled by a number of tailwinds.
We believe Citi will continue to see higher revenue as its institutional and consumer businesses gather cheap deposits and lend them prudently, leading to reasonable loss rates and favorable margins. This was the case in Q3’s results once again. In addition, the company’s buyback should be good for a mid-single-digit reduction in the share count annually. Margins have been a source of earnings growth of late and that should remain the case so long as the yield curve does not continue to flatten or invert.
Investors should take note that even in the recent tumultuous interest rate environment, Citi is performing very well. Citi is not as tied to traditional lending as most other banks, so the yield curve is not as critical, but the cost of deposits is extremely important for its massive credit card business. Profitability metrics for 2019 remain strong, however.
The dividend was slashed to essentially nothing during the financial crisis but is back to $2.04 per share, after a 13% increase earlier this year. We see continued strong dividend growth for Citigroup moving forward, adding another attractive element to the stock.
Its current yield is 2.8%, so it can already be considered an income stock. And, we see the payout rising significantly in the coming years, due to the company’s healthy payout ratio and positive EPS growth outlook.
Citigroup’s current price-to-earnings multiple of 9 is well under its historical average of 10.5 and as a result, we see the stock as attractively priced. Citigroup’s average earnings multiple is lower than that of its peers as it has been the one in the group with the most improvements to make. Given how cheap the stock is today, there is a ~% potential tailwind to total returns annually from a rising valuation.
We still see total returns of 12%+ annually going forward, consisting of the current 2.8% dividend yield, 8% earnings-per-share growth, as well as a small tailwind from a rising valuation.
Citigroup looks attractive for those seeking growth as well as rising dividends, and the recent bout of weakness in the stock has put it in value territory as well. We see Citi as the most attractive of the largest U.S. banks today, and rate the stock a buy as a result.
Final Thoughts
The big U.S. banks have come a long way from the Great Recession, when their very survival was in question. A decade removed from the Great Recession, the 4 major U.S. banks are on much firmer financial ground. JP Morgan, Bank of America, Wells Fargo, and Citigroup have returned to consistent profitability, with much stronger capital ratios and balance sheets.
The future outlook for the big banks as a whole remains positive, due to U.S. economic growth. As long as the economy stays out of a protracted downturn, investors should see these 4 companies continue to grow their earnings at a mid-to-high single-digit rate over the next several years. And, all 4 pay dividends with room for future dividend increases.