


Updated weekly on Wednesdays
The NASDAQ Dividend Achievers Index is made up of 260 stocks with 10+ consecutive years of dividend increases, that also meet certain minimum size and liquidity requirements.
It is one of the best sources to find high-quality dividend growth stocks.
The downloadable Dividend Achievers Spreadsheet List below contains the following for each stock in the index:
- Sector
- Dividend yield
- Name and ticker
- Price-to-earnings ratio
- Forward price-to-earnings ratio
Click here to download your Dividend Achievers List Excel Spreadsheet now. Keep reading this article to learn more.
Note: The Dividend Achievers list is updated using the holdings from this Invesco ETF. The ETF was recently (August 2019) updated with a number of additions and deletions. Download the database above for full rebalancing information.
You can view a preview of our Dividend Achievers spreadsheet below:
| VZ | Verizon Communications, Inc. | 55.37 | 4.4 | 227,686.8 | 14.5 | 63.3 |
| T | AT&T, Inc. | 34.02 | 6.0 | 248,077.8 | 14.3 | 85.2 |
| TDS | Telephone & Data Systems, Inc. | 26.01 | 2.4 | 3,070.1 | 19.1 | 46.4 |
| JW/A | 0.00 | 0.0 | 0.0 | |||
| MDP | Meredith Corp. | 53.19 | 4.1 | 2,447.2 | -885.0 | -3,610.0 |
| MCD | McDonald's Corp. | 214.66 | 2.1 | 163,462.1 | ||
| NKE | NIKE, Inc. | 81.55 | 1.1 | 127,385.7 | 31.9 | 33.7 |
| LOW | Lowe's Cos., Inc. | 97.13 | 2.0 | 76,663.1 | 33.2 | 65.1 |
| TJX | The TJX Cos., Inc. | 51.94 | 1.6 | 63,483.3 | 20.9 | 32.5 |
| TGT | Target Corp. | 82.94 | 3.1 | 42,405.9 | 14.4 | 44.5 |
| ROST | Ross Stores, Inc. | 103.05 | 0.9 | 37,702.3 | 23.8 | 21.4 |
| VFC | VF Corp. | 81.13 | 2.4 | 32,424.0 | 28.0 | 68.2 |
| BBY | Best Buy Co., Inc. | 67.19 | 2.7 | 18,078.8 | 12.0 | 32.7 |
| GPC | Genuine Parts Co. | 90.32 | 3.2 | 13,398.3 | 16.7 | 54.0 |
| HAS | Hasbro, Inc. | 112.67 | 2.3 | 14,258.2 | 45.8 | 106.1 |
| TIF | Tiffany & Co. | 88.24 | 2.5 | 10,756.7 | 18.9 | 47.0 |
| COLM | Columbia Sportswear Co. | 99.06 | 0.9 | 6,707.1 | 22.0 | 20.8 |
| PII | Polaris Industries Inc. | 89.73 | 2.7 | 5,570.8 | 17.1 | 45.3 |
| LEG | Leggett & Platt, Inc. | 38.60 | 4.0 | 5,055.0 | 17.8 | 71.4 |
| WSM | Williams-Sonoma, Inc. | 64.25 | 2.7 | 5,105.3 | 15.1 | 41.1 |
| CBRL | Cracker Barrel Old Country Store, Inc. | 168.24 | 3.0 | 4,027.1 | 18.4 | 54.9 |
| AAN | Aaron's, Inc. | 63.63 | 0.2 | 4,291.9 | 21.1 | 4.5 |
| MNRO | Monro, Inc. | 83.44 | 0.9 | 2,905.6 | ||
| ISCA | International Speedway Corp. | 45.10 | 1.0 | 1,961.0 | 26.0 | 27.0 |
| WMT | Walmart, Inc. | 107.11 | 1.9 | 306,225.8 | 36.9 | 71.8 |
| PG | Procter & Gamble Co. | 114.76 | 2.5 | 285,482.9 | 78.6 | 199.3 |
| KO | The Coca-Cola Co. | 52.58 | 3.0 | 223,508.1 | 32.0 | 96.7 |
| PEP | PepsiCo, Inc. | 126.67 | 3.0 | 176,798.6 | 13.9 | 41.2 |
| MO | Altria Group, Inc. | 45.75 | 6.9 | 86,231.5 | 13.6 | 94.1 |
| COST | Costco Wholesale Corp. | 268.99 | 0.9 | 118,439.6 | 32.8 | 28.7 |
| WBA | Walgreens Boots Alliance, Inc. | 51.21 | 3.4 | 46,466.7 | 10.0 | 34.3 |
| CL | Colgate-Palmolive Co. | 69.67 | 2.4 | 59,931.7 | 26.5 | 64.1 |
| KMB | Kimberly-Clark Corp. | 135.27 | 3.0 | 46,301.8 | 25.9 | 78.2 |
| SYY | Sysco Corp. | 69.04 | 2.2 | 35,253.5 | 22.5 | 49.2 |
| GIS | General Mills, Inc. | 52.07 | 3.7 | 31,608.9 | 17.9 | 66.7 |
| ADM | Archer-Daniels-Midland Co. | 37.02 | 3.7 | 20,842.0 | 15.8 | 57.9 |
| KR | The Kroger Co. | 22.80 | 0.0 | 17,797.2 | 9.9 | 0.0 |
| HRL | Hormel Foods Corp. | 40.75 | 2.0 | 21,631.4 | 21.8 | 42.8 |
| K | Kellogg Co. | 60.68 | 3.6 | 21,003.4 | 24.1 | 87.5 |
| CLX | The Clorox Co. | 156.62 | 2.6 | 19,655.4 | 24.4 | 62.3 |
| CHD | Church & Dwight Co., Inc. | 75.71 | 1.2 | 18,448.2 | 30.8 | 36.8 |
| MKC | McCormick & Co., Inc. | 156.08 | 1.4 | 20,609.1 | 30.1 | 42.1 |
| BF/B | 140779 | 0.00 | 0.0 | 0.0 | ||
| SJM | The J. M. Smucker Co. | 110.69 | 3.1 | 12,620.7 | 24.5 | 75.2 |
| BG | Bunge Ltd. | 55.44 | 3.6 | 7,937.1 | 14.7 | 52.4 |
| CASY | Casey's General Stores, Inc. | 163.69 | 0.7 | 6,056.1 | 29.4 | 20.7 |
| LANC | Lancaster Colony Corp. | 148.80 | 1.7 | 4,079.3 | 27.3 | 46.0 |
| FLO | Flowers Foods, Inc. | 23.96 | 3.0 | 5,087.7 | 29.3 | 87.6 |
| NUS | Nu Skin Enterprises, Inc. | 40.91 | 3.8 | 2,138.5 | 18.2 | 69.5 |
| JJSF | J&J Snack Foods Corp. | 183.02 | 1.1 | 3,430.4 | 37.3 | 40.0 |
| VGR | Vector Group Ltd. | 11.24 | 14.9 | 1,478.7 | 27.4 | 408.3 |
| UVV | Universal Corp. | 56.82 | 5.2 | 1,429.3 | 13.7 | 71.8 |
| TR | Tootsie Roll Industries, Inc. | 35.59 | 1.0 | 2,322.6 | 39.9 | 39.8 |
| ANDE | The Andersons, Inc. | 25.52 | 2.7 | 801.1 | 20.4 | 56.0 |
| XOM | Exxon Mobil Corp. | 70.01 | 4.7 | 300,231.8 | 16.9 | 79.2 |
| CVX | Chevron Corp. | 118.38 | 3.9 | 227,408.2 | 15.2 | 58.9 |
| EPD | Enterprise Products Partners LP | 28.50 | 6.0 | 63,402.6 | ||
| OXY | Occidental Petroleum Corp. | 46.02 | 6.6 | 35,606.4 | 9.1 | 59.6 |
| ET | Energy Transfer LP | 13.21 | 9.0 | 35,496.5 | 10.7 | 96.7 |
| OKE | ONEOK, Inc. | 67.25 | 5.0 | 28,123.1 | 22.1 | 110.5 |
| MMP | Magellan Midstream Partners LP | 64.39 | 6.1 | 14,859.9 | 10.7 | 64.9 |
| HP | Helmerich & Payne, Inc. | 42.92 | 6.5 | 4,797.6 | -62.8 | -407.0 |
| BPL | Buckeye Partners LP | 41.59 | 8.4 | 6,406.2 | -67.0 | -565.9 |
| HEP | Holly Energy Partners LP | 27.36 | 9.7 | 2,895.9 | 15.2 | 147.6 |
| TCP | TC Pipelines LP | 37.94 | 6.8 | 2,808.9 | -12.8 | -86.5 |
| TLP | TransMontaigne Partners L.P. | 40.99 | 7.6 | 665.2 | 24.3 | 183.8 |
| NC | NACCO Industries, Inc. | 49.97 | 1.4 | 349.4 | 8.0 | 11.0 |
| CB | Chubb Ltd. | 151.74 | 1.9 | 69,314.9 | 18.5 | 35.7 |
| SPGI | S&P Global, Inc. | 245.06 | 0.9 | 60,545.5 | 30.9 | 26.9 |
| AFL | Aflac, Inc. | 51.51 | 2.0 | 38,522.1 | 12.5 | 25.5 |
| TRV | The Travelers Cos., Inc. | 144.68 | 2.1 | 38,005.9 | 14.3 | 30.7 |
| TROW | T. Rowe Price Group, Inc. | 106.10 | 2.7 | 25,266.7 | 13.2 | 35.8 |
| AMP | Ameriprise Financial, Inc. | 128.33 | 2.8 | 17,441.0 | 9.3 | 25.7 |
| BEN | Franklin Resources, Inc. | 30.12 | 3.3 | 15,472.7 | 11.1 | 36.6 |
| CINF | Cincinnati Financial Corp. | 106.63 | 2.0 | 17,475.3 | 14.2 | 29.0 |
| WRB | W.R. Berkley Corp. | 69.47 | 0.6 | 12,761.9 | 19.1 | 11.3 |
| TMK | Torchmark Corp. | 84.37 | 0.8 | 9,496.7 | 13.1 | 10.1 |
| AFG | American Financial Group, Inc. | 99.00 | 1.5 | 8,972.3 | ||
| FDS | FactSet Research Systems, Inc. | 274.70 | 1.0 | 10,516.2 | 31.8 | 30.5 |
| BRO | Brown & Brown, Inc. | 35.77 | 0.9 | 10,123.1 | 26.0 | 22.7 |
| SEIC | SEI Investments Co. | 56.66 | 1.2 | 8,599.3 | 18.0 | 20.9 |
| IVZ | Invesco Ltd. | 16.40 | 7.0 | 8,317.9 | 11.3 | 79.1 |
| ERIE | Erie Indemnity Co. | 217.43 | 1.6 | 10,127.0 | 33.1 | 53.5 |
| CBSH | Commerce Bancshares, Inc. (Missouri) | 55.59 | 1.7 | 6,246.8 | 14.8 | 25.2 |
| CFR | Cullen/Frost Bankers, Inc. | 85.94 | 3.1 | 5,463.6 | 12.0 | 37.4 |
| PBCT | People's United Financial, Inc. | 14.82 | 4.6 | 6,045.9 | 11.3 | 52.4 |
| ORI | Old Republic International Corp. | 22.12 | 3.6 | 6,722.5 | 8.9 | 31.6 |
| RNR | RenaissanceRe Holdings Ltd. | 184.05 | 0.7 | 8,094.5 | 13.6 | 9.9 |
| BOKF | BOK Financial Corp. | 76.58 | 2.6 | 5,543.5 | 11.3 | 29.1 |
| PB | Prosperity Bancshares, Inc. | 64.10 | 2.4 | 4,509.9 | 13.6 | 33.0 |
| LAZ | Lazard Ltd. | 33.92 | 5.2 | 4,462.7 | 10.2 | 53.0 |
| THG | The Hanover Insurance Group, Inc. | 130.10 | 1.8 | 5,151.5 | 17.7 | 31.8 |
| EV | Eaton Vance Corp. | 40.64 | 3.3 | 4,705.6 | 11.6 | 38.3 |
| AXS | AXIS Capital Holdings Ltd. | 63.13 | 2.5 | 5,319.7 | 48.6 | 121.9 |
| OZK | Bank OZK | 26.71 | 3.1 | 3,518.5 | 8.4 | 26.3 |
| UBSI | United Bankshares, Inc. (West Virginia) | 35.19 | 3.8 | 3,652.3 | 14.0 | 53.0 |
| EVR | Evercore, Inc. | 79.56 | 2.6 | 3,218.9 | 8.9 | 22.9 |
| UMBF | UMB Financial Corp. | 63.58 | 1.8 | 3,162.9 | 15.7 | 29.0 |
| CBU | Community Bank System, Inc. | 59.60 | 2.5 | 3,160.3 | 18.0 | 44.7 |
| RLI | RLI Corp. | 89.88 | 1.0 | 4,011.1 | 32.1 | 31.9 |
| MCY | Mercury General Corp. | 54.25 | 4.6 | 3,024.6 | 15.3 | 70.3 |
| AEL | American Equity Investment Life Holding Co. | 22.19 | 0.0 | 2,068.8 | 9.5 | 0.0 |
| BANF | BancFirst Corp. (Oklahoma) | 54.11 | 2.2 | 1,805.8 | 13.4 | 29.2 |
| WABC | Westamerica Bancorporation | 59.26 | 2.6 | 1,639.3 | 21.1 | 55.8 |
| SRCE | 1st Source Corp. | 43.19 | 2.4 | 1,127.6 | 12.9 | 30.4 |
| TMP | Tompkins Financial Corp. | 76.30 | 2.5 | 1,176.0 | 14.5 | 36.8 |
| SBSI | Southside Bancshares, Inc. | 32.52 | 3.6 | 1,120.5 | 14.8 | 54.1 |
| CTBI | Community Trust Bancorp, Inc. (Kentucky) | 39.43 | 3.6 | 711.8 | 10.7 | 38.6 |
| BMRC | Bank of Marin Bancorp | 40.40 | 1.7 | 560.0 | 16.4 | 28.5 |
| WHG | Westwood Holdings Group, Inc. | 29.68 | 9.6 | 265.0 | 19.1 | 183.4 |
| JNJ | Johnson & Johnson | 129.66 | 2.8 | 345,124.3 | 21.2 | 59.2 |
| ABT | Abbott Laboratories | 84.08 | 1.5 | 149,981.6 | 51.3 | 74.9 |
| MDT | Medtronic Plc | 100.66 | 2.0 | 135,779.0 | 29.3 | 57.8 |
| CVS | CVS Health Corp. | 57.34 | 3.7 | 70,267.8 | -130.3 | -481.9 |
| BDX | Becton, Dickinson & Co. | 242.09 | 1.3 | 65,312.9 | 83.2 | 105.1 |
| SYK | Stryker Corp. | 209.62 | 1.0 | 78,803.5 | 22.1 | 21.2 |
| MCK | McKesson Corp. | 135.89 | 1.1 | 25,701.7 | 45.0 | 50.5 |
| ABC | AmerisourceBergen Corp. | 83.61 | 1.9 | 17,522.3 | 18.5 | 34.8 |
| CAH | Cardinal Health, Inc. | 42.14 | 4.4 | 12,792.7 | 369.6 | 1,640.9 |
| WST | West Pharmaceutical Services, Inc. | 138.46 | 0.4 | 10,208.3 | 44.7 | 19.4 |
| PRGO | Perrigo Co. Plc | 49.57 | 1.5 | 6,856.7 | 59.2 | 89.2 |
| ENSG | The Ensign Group, Inc. | 50.43 | 0.4 | 2,710.4 | 25.8 | 9.5 |
| ATRI | Atrion Corp. | 761.30 | 0.7 | 1,410.7 | 40.1 | 27.6 |
| NHC | National HealthCare Corp. | 83.45 | 2.4 | 1,288.9 | 15.3 | 36.4 |
| UNP | Union Pacific Corp. | 165.35 | 2.0 | 118,593.5 | 19.5 | 39.0 |
| MMM | 3M Co. | 158.70 | 3.4 | 94,178.9 | 18.8 | 64.3 |
| UTX | United Technologies Corp. | 127.13 | 2.3 | 111,132.6 | 20.5 | 46.3 |
| LMT | Lockheed Martin Corp. | 365.98 | 2.3 | 103,577.9 | 17.7 | 41.5 |
| CAT | Caterpillar, Inc. | 119.32 | 2.8 | 68,680.9 | 11.0 | 31.0 |
| CSX | CSX Corp. | 65.98 | 1.4 | 53,070.7 | 15.8 | 21.8 |
| GD | General Dynamics Corp. | 179.13 | 2.2 | 52,185.4 | 15.8 | 34.0 |
| RTN | Raytheon Co. | 183.66 | 2.0 | 51,481.4 | 16.9 | 33.1 |
| NOC | Northrop Grumman Corp. | 355.49 | 1.4 | 59,938.4 | 17.3 | 24.0 |
| FDX | FedEx Corp. | 157.60 | 1.6 | 42,039.6 | 79.0 | 127.4 |
| ITW | Illinois Tool Works, Inc. | 147.39 | 2.7 | 48,191.8 | 19.7 | 52.8 |
| EMR | Emerson Electric Co. | 58.66 | 3.2 | 37,381.2 | ||
| WM | Waste Management, Inc. | 116.17 | 1.7 | 49,253.3 | 28.1 | 47.3 |
| ROP | Roper Technologies, Inc. | 345.89 | 0.5 | 36,587.9 | 31.9 | 16.3 |
| RSG | Republic Services, Inc. | 88.03 | 1.7 | 28,235.7 | 27.1 | 46.2 |
| CMI | Cummins, Inc. | 150.55 | 3.0 | 24,362.2 | 9.2 | 27.0 |
| CTAS | Cintas Corp. | 256.26 | 0.8 | 26,358.6 | 31.0 | 24.7 |
| SWK | Stanley Black & Decker, Inc. | 135.93 | 0.0 | 20,869.2 | 28.5 | 0.0 |
| HRS | Harris Corp. | 189.13 | 1.4 | 22,341.2 | 24.9 | 34.6 |
| FAST | Fastenal Co. | 28.76 | 2.8 | 16,744.2 | 21.5 | 61.2 |
| GWW | W.W. Grainger, Inc. | 267.78 | 2.0 | 14,733.1 | 18.2 | 37.1 |
| LLL | L3 Technologies, Inc. | 245.17 | 1.3 | 19,479.0 | 24.6 | 32.6 |
| DOV | Dover Corp. | 89.66 | 2.1 | 13,234.9 | 21.7 | 45.8 |
| CHRW | C.H. Robinson Worldwide, Inc. | 81.99 | 2.4 | 11,106.7 | 16.3 | 39.3 |
| EXPD | Expeditors International of Washington, Inc. | 71.95 | 1.3 | 12,462.8 | 19.5 | 25.6 |
| ROL | Rollins, Inc. | 32.49 | 1.2 | 10,646.6 | 47.0 | 57.4 |
| JBHT | J.B. Hunt Transport Services, Inc. | 95.94 | 1.0 | 10,455.8 | 22.0 | 22.5 |
| RHI | Robert Half International, Inc. | 55.56 | 2.1 | 6,577.5 | 14.5 | 30.5 |
| NDSN | Nordson Corp. | 131.38 | 1.0 | 7,657.5 | 23.6 | 23.9 |
| GGG | Graco, Inc. | 45.40 | 1.3 | 7,676.4 | 22.2 | 29.5 |
| AOS | A. O. Smith Corp. | 44.99 | 1.9 | 6,337.1 | ||
| CSL | Carlisle Cos., Inc. | 136.46 | 1.2 | 7,871.6 | 19.1 | 22.0 |
| TTC | The Toro Co. | 71.35 | 1.2 | 7,596.3 | 25.8 | 30.8 |
| DCI | Donaldson Co., Inc. | 47.26 | 1.6 | 6,071.6 | 19.5 | 32.0 |
| HUBB | Hubbell, Inc. | 125.37 | 2.6 | 6,859.9 | 18.5 | 48.4 |
| LECO | Lincoln Electric Holdings, Inc. | 82.19 | 2.2 | 5,121.5 | 16.6 | 36.0 |
| DNB | ||||||
| ITT | ITT, Inc. | 56.71 | 1.0 | 5,077.4 | 16.5 | 16.0 |
| HEI | HEICO Corp. | 137.98 | 0.1 | 18,689.6 | 62.0 | 5.8 |
| MSA | MSA Safety, Inc. | 100.23 | 1.5 | 3,955.1 | 31.8 | 48.5 |
| MSM | MSC Industrial Direct Co., Inc. | 67.10 | 3.6 | 3,739.9 | 12.6 | 46.0 |
| RBC | Regal Beloit Corp. | 70.92 | 1.6 | 3,117.6 | 11.7 | 18.4 |
| R | Ryder System, Inc. | 47.40 | 4.4 | 2,588.9 | 7.9 | 35.0 |
| HCSG | Healthcare Services Group, Inc. | 22.73 | 3.4 | 1,715.7 | 19.9 | 67.2 |
| ABM | ABM Industries, Inc. | 39.93 | 1.8 | 2,668.3 | 30.7 | 54.3 |
| FELE | Franklin Electric Co., Inc. | 44.70 | 1.2 | 2,102.4 | 21.8 | 25.4 |
| BRC | Brady Corp. | 50.10 | 1.7 | 2,658.6 | 20.2 | 34.0 |
| MATW | Matthews International Corp. | 31.96 | 2.4 | 1,020.5 | 16.2 | 39.4 |
| MGRC | McGrath RentCorp | 64.34 | 2.2 | 1,552.2 | 17.9 | 39.9 |
| TNC | Tennant Co. | 69.56 | 1.2 | 1,280.4 | 33.4 | 41.3 |
| LNN | Lindsay Corp. | 89.02 | 1.4 | 960.3 | 170.5 | 237.4 |
| GRC | The Gorman-Rupp Co. | 31.06 | 1.7 | 820.3 | 21.4 | 36.1 |
| VSEC | VSE Corp. | 28.94 | 1.1 | 319.2 | 8.8 | 10.0 |
| MSFT | Microsoft Corp. | 134.24 | 1.4 | 1,028,413.4 | 26.3 | 35.9 |
| IBM | International Business Machines Corp. | 138.23 | 4.5 | 124,669.2 | 14.2 | 64.0 |
| ACN | Accenture Plc | 186.81 | 1.5 | 120,298.6 | 25.5 | 37.7 |
| TXN | Texas Instruments Incorporated | 119.33 | 2.5 | 111,100.8 | 21.4 | 52.7 |
| ADP | Automatic Data Processing, Inc. | 163.06 | 1.9 | 70,943.9 | 30.9 | 57.8 |
| QCOM | QUALCOMM, Inc. | 68.49 | 3.6 | 82,871.5 | 24.0 | 87.4 |
| ADI | Analog Devices, Inc. | 108.83 | 1.8 | 40,407.5 | 25.8 | 46.7 |
| XLNX | Xilinx, Inc. | 105.36 | 1.4 | 26,690.2 | 28.3 | 38.9 |
| MCHP | Microchip Technology, Inc. | 86.95 | 1.7 | 20,247.3 | 55.4 | 95.0 |
| MXIM | Maxim Integrated Products, Inc. | 53.71 | 3.4 | 14,738.2 | 17.8 | 60.6 |
| BR | Broadridge Financial Solutions, Inc. | 122.76 | 1.6 | 14,062.3 | 29.5 | 46.5 |
| JKHY | Jack Henry & Associates, Inc. | 135.77 | 1.1 | 10,489.7 | 35.4 | 39.3 |
| BMI | Badger Meter, Inc. | 53.36 | 1.1 | 1,563.7 | 42.6 | 47.6 |
| CASS | Cass Information Systems, Inc. | 48.44 | 2.0 | 706.4 | 23.1 | 45.3 |
| ECL | Ecolab, Inc. | 198.30 | 0.9 | 56,609.5 | 38.2 | 34.8 |
| SHW | The Sherwin-Williams Co. | 504.12 | 0.8 | 46,023.8 | 39.7 | 31.7 |
| APD | Air Products & Chemicals, Inc. | 221.13 | 2.0 | 48,791.0 | 28.5 | 58.2 |
| PPG | PPG Industries, Inc. | 111.23 | 1.7 | 26,223.8 | 21.8 | 37.7 |
| NUE | Nucor Corp. | 50.92 | 3.1 | 15,564.1 | 7.2 | 22.0 |
| IFF | International Flavors & Fragrances, Inc. | 119.79 | 0.0 | 12,686.6 | 34.7 | 0.0 |
| WLK | Westlake Chemical Corp. | 61.65 | 1.6 | 8,107.8 | 12.9 | 20.4 |
| ALB | Albemarle Corp. | 67.60 | 2.1 | 6,934.9 | 10.5 | 22.0 |
| RPM | RPM International, Inc. | 67.51 | 2.0 | 8,675.3 | 33.2 | 68.0 |
| ATR | AptarGroup, Inc. | 121.56 | 1.2 | 7,667.0 | 35.4 | 40.8 |
| SON | Sonoco Products Co. | 58.39 | 2.8 | 5,868.5 | 19.2 | 54.5 |
| RGLD | Royal Gold, Inc. | 123.67 | 0.9 | 7,836.2 | 85.9 | 73.9 |
| NEU | NewMarket Corp. | 445.00 | 1.6 | 4,977.5 | 19.4 | 30.6 |
| BMS | Bemis Co., Inc. | 57.25 | 2.2 | 5,221.2 | 22.9 | 49.9 |
| SLGN | Silgan Holdings, Inc. | 29.99 | 1.4 | 3,310.9 | 16.5 | 23.3 |
| KWR | Quaker Chemical Corp. | 167.01 | 0.9 | 2,237.2 | 39.1 | 34.9 |
| SXT | Sensient Technologies Corp. | 64.99 | 2.2 | 2,760.0 | 18.7 | 40.3 |
| FUL | H.B. Fuller Co. | 44.22 | 1.4 | 2,280.1 | 17.5 | 24.4 |
| SCL | Stepan Co. | 93.37 | 1.0 | 2,102.1 | 20.6 | 21.6 |
| CMP | Compass Minerals International, Inc. | 52.29 | 5.3 | 1,833.4 | 29.9 | 159.4 |
| HWKN | Hawkins, Inc. | 44.80 | 2.0 | 486.4 | 19.0 | 38.1 |
| WELL | Welltower, Inc. | 86.70 | 4.1 | 34,612.1 | 96.5 | 393.4 |
| DLR | Digital Realty Trust, Inc. | 117.03 | 3.6 | 24,392.8 | 98.0 | 349.9 |
| O | Realty Income Corp. | 70.88 | 3.8 | 22,111.5 | 54.1 | 207.4 |
| ESS | Essex Property Trust, Inc. | 299.12 | 2.5 | 19,680.9 | 48.1 | 122.4 |
| WPC | W.P. Carey, Inc. | 84.84 | 4.9 | 14,321.9 | 29.9 | 146.8 |
| FRT | Federal Realty Investment Trust | 128.68 | 3.2 | 9,730.3 | 39.0 | 123.5 |
| ELS | Equity LifeStyle Properties, Inc. | 127.44 | 1.8 | 11,523.1 | 43.0 | 78.9 |
| NNN | National Retail Properties, Inc. | 54.13 | 3.7 | 8,751.3 | 38.0 | 141.9 |
| OHI | Omega Healthcare Investors, Inc. | 36.41 | 7.3 | 7,722.9 | 28.5 | 209.2 |
| NHI | National Health Investors, Inc. | 79.93 | 5.1 | 3,442.1 | 22.3 | 113.2 |
| SKT | Tanger Factory Outlet Centers, Inc. | 15.58 | 9.0 | 1,460.2 | 20.1 | 180.8 |
| UHT | Universal Health Realty Income Trust | 90.79 | 3.0 | 1,237.8 | 72.2 | 216.7 |
| UBA | Urstadt Biddle Properties, Inc. | 20.71 | 5.3 | 827.6 | 35.2 | 184.7 |
| NEE | NextEra Energy, Inc. | 212.53 | 2.2 | 101,282.4 | 30.3 | 67.7 |
| DUK | Duke Energy Corp. | 88.90 | 4.2 | 64,737.9 | 19.6 | 81.8 |
| D | Dominion Energy, Inc. | 74.69 | 4.7 | 60,430.8 | 50.1 | 233.6 |
| SO | The Southern Co. | 57.35 | 4.3 | 59,515.4 | 13.4 | 56.9 |
| XEL | Xcel Energy, Inc. | 60.69 | 2.6 | 31,122.1 | 24.8 | 64.4 |
| ED | Consolidated Edison, Inc. | 86.91 | 3.4 | 28,773.6 | 20.5 | 69.0 |
| WEC | WEC Energy Group, Inc. | 88.16 | 2.6 | 27,723.7 | 25.4 | 66.1 |
| PPL | PPL Corp. | 29.78 | 5.6 | 21,356.3 | 12.1 | 67.1 |
| ES | Eversource Energy | 77.78 | 2.7 | 25,090.6 | 28.7 | 77.1 |
| EIX | Edison International | 72.77 | 3.3 | 26,273.1 | -95.6 | -318.2 |
| CNP | CenterPoint Energy, Inc. | 28.30 | 3.9 | 14,492.7 | 44.2 | 171.7 |
| CMS | CMS Energy Corp. | 58.97 | 2.5 | 16,715.1 | 28.6 | 71.9 |
| ATO | Atmos Energy Corp. | 107.97 | 1.9 | 12,675.6 | 25.7 | 48.0 |
| LNT | Alliant Energy Corp. | 50.67 | 2.7 | 11,918.9 | 23.4 | 64.1 |
| UGI | UGI Corp. | 47.29 | 2.3 | 8,310.5 | 24.8 | 56.3 |
| OGE | OGE Energy Corp. | 42.32 | 3.4 | 8,505.4 | 20.3 | 68.1 |
| WTR | Aqua America, Inc. | 41.62 | 2.1 | 8,877.7 | 54.4 | 115.9 |
| MDU | MDU Resources Group, Inc. | 26.29 | 3.1 | 5,231.3 | 17.9 | 54.8 |
| NFG | National Fuel Gas Co. | 47.86 | 3.6 | 4,131.0 | 14.0 | 49.9 |
| POR | Portland General Electric Co. | 54.95 | 2.7 | 4,888.6 | 24.6 | 66.1 |
| NJR | New Jersey Resources Corp. | 45.98 | 2.5 | 4,125.7 | 30.2 | 76.3 |
| SWX | Southwest Gas Holdings, Inc. | 88.39 | 2.4 | 4,716.6 | 23.3 | 55.5 |
| BKH | Black Hills Corp. | 77.52 | 2.6 | 4,681.7 | 20.4 | 53.0 |
| SR | Spire, Inc. (Missouri) | 80.78 | 2.9 | 4,084.0 | 21.4 | 62.3 |
| NWE | NorthWestern Corp. | 68.83 | 3.3 | 3,452.3 | 16.1 | 53.0 |
| APU | AmeriGas Partners LP | 31.96 | 11.8 | 2,996.5 | 37.8 | 446.2 |
| SJI | South Jersey Industries, Inc. | 31.68 | 3.6 | 2,921.3 | -176.5 | -633.4 |
| AWR | American States Water Co. | 79.71 | 1.4 | 2,872.2 | 38.6 | 54.4 |
| CWT | California Water Service Group | 52.56 | 1.5 | 2,516.3 | 42.8 | 63.0 |
| MGEE | MGE Energy, Inc. | 73.84 | 1.8 | 2,546.7 | 29.0 | 52.7 |
| NWN | Northwest Natural Holding Co. | 69.65 | 2.7 | 2,152.1 | 29.5 | 79.0 |
| SJW | SJW Group | 64.08 | 1.8 | 1,799.0 | 34.9 | 64.0 |
| CPK | Chesapeake Utilities Corp. | 91.70 | 1.6 | 1,494.1 | 25.7 | 41.8 |
| MSEX | Middlesex Water Co. | 57.66 | 0.0 | 950.8 | 28.0 | 0.0 |
| CTWS | Connecticut Water Service, Inc. | 69.89 | 1.8 | 843.1 | 41.4 | 74.0 |
| Ticker | Name | Price | Dividend Yield | Market Cap ($M) | P/E Ratio | Payout Ratio |
Use The Dividend Achievers List To Find Quality Dividend Growth Stocks
The list of all 260 Dividend Achievers is valuable because it provides dividend growth investors with a long list of stocks that have increased their dividends for at least 10+ consecutive years.
These are companies with shareholder-friendly management teams committed to rewarding investors with rising dividends, and have the ability to increase their dividends due to their long-term earnings growth.
Together, these two criteria form a powerful pair. They become even more powerful when an investor buys high-quality dividend growth stocks when they are undervalued.
The spreadsheet above allows you to sort by price-to-earnings ratio (or dividend yield) so you can quickly find undervalued dividend paying businesses with 10+ years of consecutive dividend increases.
Here’s how to use the Dividend Achievers list to quickly find high quality dividend growth stocks potentially trading at a discount:
- Download the list
- Sort by P/E ratio (or forward P/E ratio), lowest to highest
- Filter out stocks yielding less than 3%
- Research the top stocks further to
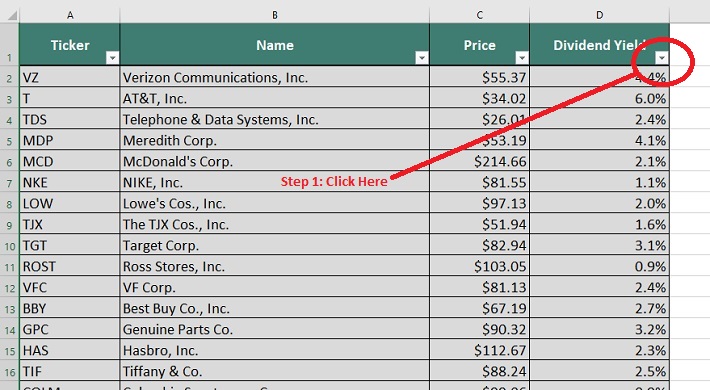
Here’s how to filter out stocks yielding less than 3% if you are unfamiliar with Excel:
Step 1: Click on the dividend yield filter button:
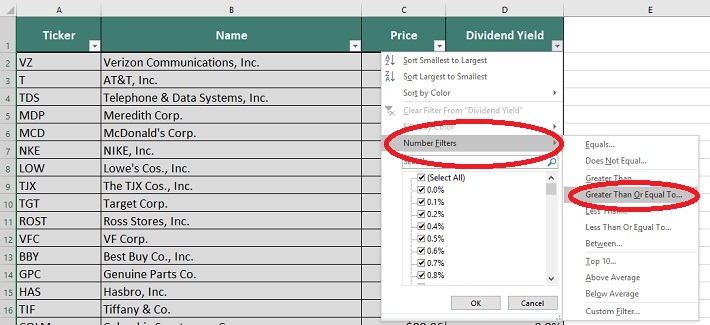
Step 2: Go to ‘Number Filters’, and then click on ‘Greater Than or Equal To’:
Step 3: Enter your desired yield amount (as a decimal), .03 in the example above. Then press ‘Ok’.
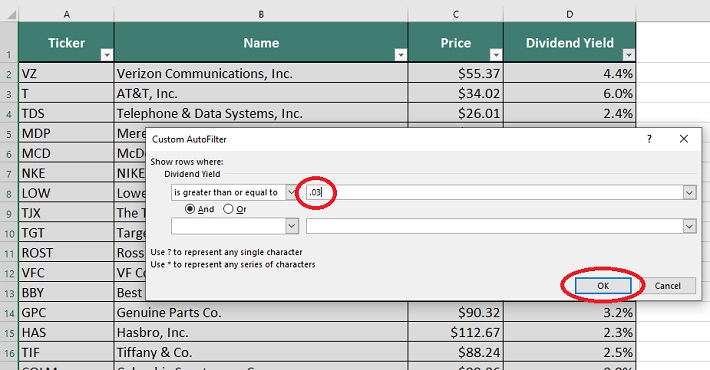
That’s it; the remaining stocks will all have dividend yields above 3%.
Other Dividend Lists
The Dividend Achievers list is not the only way to quickly screen for stocks with long histories of dividend growth. The Dividend Aristocrats Index is comprised of 57 stocks with 25+ years of consecutive dividend increases. It is more exclusive than the Dividend Achievers Index.
The Dividend Kings List is even more exclusive. It is comprised of 26 stocks with 50+ years of consecutive dividend increases.
The Sure Dividend Blue Chip Stocks list has 270+ stocks that belong to either the Dividend Achievers, Dividend Aristocrats, or Dividend Kings list.
In fact, the Dividend Aristocrats list has substantially outperformed both the S&P 500 and the Dividend Achievers over the last decade.
Performance of the Dividend Achievers Index
The Dividend Aristocrats List has realized outstanding performance over the last decade.
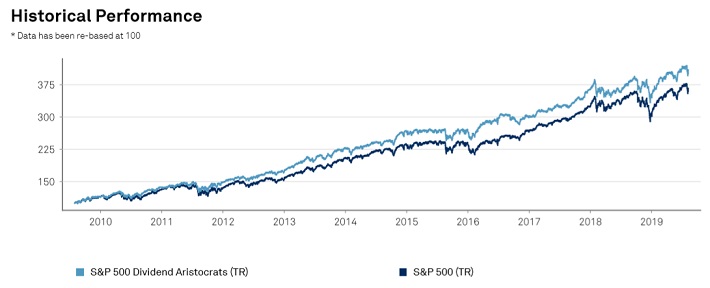
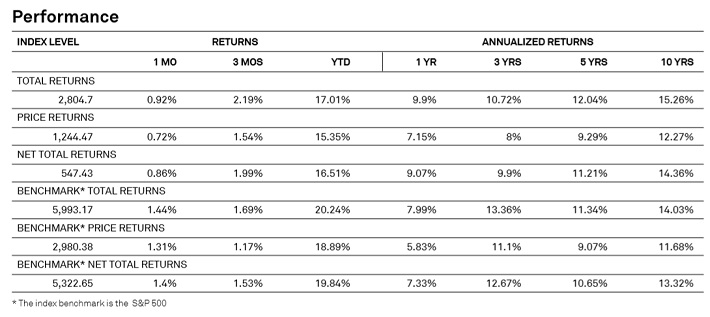
Source: S&P 500 Dividend Aristocrats Factsheet
As you can see in the above table, in the past 10 years the Dividend Aristocrats generated total annual returns of 14.4% per year, compared with total annual returns of 13.3% for the broader S&P 500 Index in the same time.
This is a strong outperformance, and shows the value of investing in high-quality dividend growth stocks. From that perspective, it stands to reason that the Dividend Achievers Index would also outperform the S&P 500 Index.
But that’s not the case. In the past five years, the major ETF that tracks the S&P 500 Index (SPY) has outperformed the equivalent Dividend Achievers ETF. This is because there are critical differences…
First, the Dividend Aristocrats index is equally weighted, while the Dividend Achievers index is market cap weighted.
On the surface, this doesn’t sound like it matters much, but it has serious repercussions for returns.
This means that larger stocks with higher market caps make up a greater portion of the Dividend Achievers index. The top 5 Dividend Achievers by weight are listed below (along with their weight):
- Microsoft (MSFT) – 4.2%
- Johnson & Johnson (JNJ) – 3.8%
- ExxonMobil (XOM) – 3.5%
- Wal-Mart (WMT) – 3.5%
- Visa (V) – 3.5%
I’m not saying these large holdings don’t make good dividend investments. Market cap has virtually no sway in determining the best Dividend Achievers. The problem with market cap weighting is that it is the opposite of value investing .
Imagine that a stocks’ price-to-earnings ratio rises from 10 to 20 while earnings do not change. The company’s market cap would double. In the real world, paying twice as much for the same thing is not a ‘good deal’. With market cap weighting, the Dividend Achievers index would hold double its investment in the business that saw its P/E ratio double.
And it gets worse from there…
The Dividend Achievers index does not increase ownership in businesses that have seen their market caps decline. This means that if a different business saw its price-to-earnings ratio decline from 30 to 15 (and earnings were unchanged), the Dividend Achievers Index would see its ownership of this business fall by 50%.
Market cap weighting buys high and sells low. Market cap weighting does not take advantage of valuation, while equal weighting does.
With equal weighting, if a company’s price-to-earnings ratio falls by 50%, the fund will have to buy more to keep weights equal. Similarly, an equal weighted fund will have to sell when the price-to-earnings ratio of a business rises to keep the fund equally weighted.
Another difference between the Dividend Aristocrats and the Dividend Achievers is dividend history. 10 years is a sizeable streak of consecutive dividend payments. It covers (at best) 1 economic cycle.
25 years of consecutive dividend increases covers multiple economic cycles. Dividend Achievers do not have the same level of consistency as Dividend Aristocrats. Dividend history matters.
The 5-year performance of the Invesco Dividend Achievers ETF (PFM) versus the S&P 500 ETF (SPY) is shown below:

Source: YCharts
Another disadvantage PFM has is its higher expense ratio. PFM has an expense ratio of 0.55% versus 0.09% for SPY.
Thoughts on Underperformance
SPY and PFM are both market cap weighted. PFM has a higher expense ratio, but before running historical performance numbers I would have expected PFM to outperform SPY.
Dividend stocks have historically outperformed non dividend paying stocks. Stocks with long dividend histories (Dividend Aristocrats) have historically outperformed the market.
Why haven’t the Dividend Achievers outperformed?
The Dividend Achievers index has compounded its dividend payments at 7.2% a year over the last decade. This is reasonably good growth.
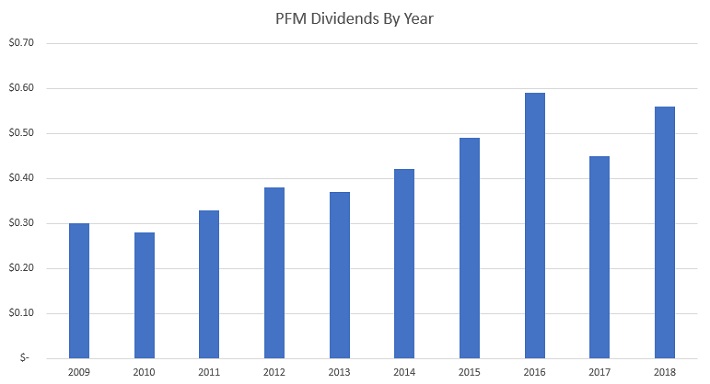
With 10 year average dividend growth of 7.2% a year and a current 2.2% dividend yield PFM should compound investor wealth at just under 10% a year going forward. PFM currently has a price-to-earnings ratio of 18, versus 22 for the S&P 500.
The funds historical underperformance is likely due to many of its securities being overvalued. I do not have access to the funds 2005 or 2006 prospectus, but it would be very interesting to see the average price-to-earnings ratio and dividend yield of the fund at that time.
The inability of the Dividend Achievers index to outperform the S&P 500 over a period of time that has been relatively favorable for dividend stocks ( due to falling interest rates) is perplexing.
Regardless, there are better dividend ETFs for fund investors to choose from.
A Starting Point
The Dividend Achievers list is best used as a starting point for finding high-quality dividend growth stocks.
Being a Dividend Achiever in itself does not automatically guarantee an individual stock has a durable competitive advantage, or that it is a good investment.
Long-term investors should verify to that an investment has a strong and durable competitive advantage, a shareholder friendly management, and trades at a reasonable (preferably undervalued) valuation.
Combing the Dividend Achievers Index for these type of businesses can greatly speed up the search for high quality shareholder friendly businesses trading at fair or better prices.