


Updated on September 13th, 2019 by Bob Ciura
The U.S. retail industry is in a state of change. Consumers are increasingly shopping online, favoring the convenience of delivery rather than taking a trip to a store.
Many retailers are struggling to adapt, having relied too heavily on malls for traffic. Some retail bankruptcies have already occurred, and more are likely to follow as the trend toward Internet retail seems unstoppable.
But not all retailers are doomed. We still view many retail stocks favorably, although investors must be selective and focus on stocks that offer a combination of value, growth, and/or dividends.
You can download an Excel spreadsheet of all retail stocks (with metrics that matter) by clicking the link below:
You can also see a preview of the retail stocks spreadsheet in the table below:
| STMP | Stamps.com, Inc. | 74.98 | 0.0 | 1,270 | 12.7 | 0.0 | 1.33 |
| CVNA | Carvana Co. | 79.76 | 0.0 | 12,154 | -31.9 | 0.0 | 2.04 |
| GES | Guess?, Inc. | 19.11 | 4.2 | 1,242 | 94.0 | 391.1 | 1.29 |
| TGT | Target Corporation | 108.97 | 2.4 | 55,661 | 18.0 | 43.7 | 0.62 |
| AN | AutoNation, Inc. | 51.68 | 0.0 | 4,581 | 11.7 | 0.0 | 0.61 |
| BURL | Burlington Stores, Inc. | 197.01 | 0.0 | 13,055 | 31.0 | 0.0 | 1.05 |
| DG | Dollar General Corp. | 157.10 | 0.8 | 40,385 | 25.1 | 19.5 | 0.81 |
| RAD | Rite Aid Corp. | 7.65 | 0.0 | 410 | -0.5 | 0.0 | 1.29 |
| LAD | Lithia Motors, Inc. | 126.29 | 0.9 | 3,082 | 11.0 | 9.7 | 0.56 |
| COST | Costco Wholesale Corporation | 290.69 | 0.9 | 127,140 | 35.7 | 32.1 | 0.94 |
| BJ | BJ's Wholesale Club Holdings, Inc. | 27.72 | 0.0 | 3,761 | 18.0 | 0.0 | 1.20 |
| CHS | Chico's FAS, Inc. | 4.00 | 8.8 | 502 | -43.0 | -376.3 | 0.41 |
| BKNG | Booking Holdings, Inc. | 2,041.41 | 0.0 | 86,784 | 22.4 | 0.0 | 1.14 |
| CAL | Caleres, Inc. | 22.35 | 1.3 | 937 | -67.8 | -85.5 | 1.04 |
| DKS | Dick's Sporting Goods, Inc. | 39.20 | 2.6 | 3,489 | 11.6 | 30.1 | 0.83 |
| CASY | Casey's General Stores, Inc. | 166.58 | 0.8 | 6,364 | 28.1 | 21.1 | 0.81 |
| KSS | Kohl's Corp. | 52.36 | 4.9 | 8,331 | 11.5 | 56.1 | 1.07 |
| ROST | Ross Stores, Inc. | 108.31 | 0.9 | 39,883 | 24.6 | 23.1 | 0.80 |
| DDS | Dillard's, Inc. | 68.26 | 0.6 | 1,702 | 14.0 | 8.5 | 0.71 |
| WMT | Walmart Inc. | 116.02 | 1.8 | 332,553 | 26.2 | 48.0 | 0.65 |
| EBAY | eBay, Inc. | 40.29 | 0.7 | 33,793 | 15.5 | 10.8 | 1.01 |
| TJX | The TJX Companies, Inc. | 56.70 | 1.6 | 68,607 | 23.0 | 37.2 | 0.85 |
| WBA | Walgreens Boots Alliance, Inc. | 58.06 | 3.2 | 51,220 | 11.4 | 35.8 | 0.82 |
| MUSA | Murphy USA, Inc. | 91.49 | 0.0 | 2,906 | 18.4 | 0.0 | 0.64 |
| BBY | Best Buy Co., Inc. | 67.84 | 3.0 | 17,886 | 12.3 | 36.2 | 1.67 |
| ANF | Abercrombie & Fitch Co. | 17.05 | 4.7 | 1,119 | 16.1 | 75.5 | 1.00 |
| URBN | Urban Outfitters, Inc. | 26.90 | 0.0 | 2,580 | 11.0 | 0.0 | 0.95 |
| KR | The Kroger Co. | 25.57 | 2.5 | 20,441 | 12.7 | 31.8 | 0.76 |
| ORLY | O'Reilly Automotive, Inc. | 393.90 | 0.0 | 30,138 | 23.2 | 0.0 | 0.62 |
| KMX | CarMax, Inc. | 86.53 | 0.0 | 14,328 | 17.0 | 0.0 | 0.76 |
| EXPE | Expedia Group, Inc. | 131.65 | 1.0 | 18,741 | 31.7 | 30.8 | 0.89 |
| BOOT | Boot Barn Holdings, Inc. | 36.16 | 0.0 | 1,003 | 24.4 | 0.0 | 1.67 |
| MIK | Michaels Cos., Inc. | 9.39 | 0.0 | 1,434 | 4.6 | 0.0 | 1.12 |
| PAG | Penske Automotive Group, Inc. | 48.15 | 3.1 | 3,914 | 9.1 | 28.6 | 0.72 |
| SFLY | Shutterfly, Inc. | 50.93 | 0.0 | 1,751 | 203.9 | 0.0 | 0.84 |
| ABG | Asbury Automotive Group, Inc. | 101.80 | 0.0 | 1,969 | 10.9 | 0.0 | 0.83 |
| AZO | AutoZone, Inc. | 1,129.07 | 0.0 | 27,694 | 19.8 | 0.0 | 0.33 |
| JWN | Nordstrom, Inc. | 34.62 | 4.3 | 5,363 | 11.4 | 48.5 | 0.97 |
| TIF | Tiffany & Co. | 95.05 | 2.4 | 11,670 | 20.7 | 50.5 | 1.46 |
| RCII | Rent-A-Center, Inc. | 25.58 | 0.0 | 1,383 | 11.9 | 0.0 | 0.35 |
| DLTR | Dollar Tree, Inc. | 111.94 | 0.0 | 26,487 | -16.9 | 0.0 | 0.64 |
| GPS | Gap, Inc. | 19.18 | 5.1 | 7,207 | 7.8 | 39.4 | 0.92 |
| AMZN | Amazon.com, Inc. | 1,843.55 | 0.0 | 911,923 | 74.7 | 0.0 | 1.71 |
| AAP | Advance Auto Parts, Inc. | 155.20 | 0.2 | 11,079 | 25.8 | 4.0 | 0.66 |
| BKE | The Buckle, Inc. | 21.35 | 4.7 | 1,050 | 11.1 | 52.1 | 0.83 |
| TSCO | Tractor Supply Co. | 99.34 | 1.3 | 11,847 | 21.9 | 28.2 | 1.00 |
| FIVE | Five Below, Inc. | 135.68 | 0.0 | 7,515 | 48.2 | 0.0 | 1.41 |
| AEO | American Eagle Outfitters, Inc. | 17.81 | 3.1 | 2,973 | 11.6 | 36.2 | 1.13 |
| FL | Foot Locker, Inc. | 40.59 | 3.6 | 4,445 | 8.8 | 31.5 | 1.04 |
| EYE | National Vision Holdings, Inc. | 31.85 | 0.0 | 2,465 | 165.5 | 0.0 | 1.20 |
| QRTEA | Qurate Retail, Inc. | 11.81 | 0.0 | 4,843 | 10.1 | 0.0 | 1.03 |
| ZUMZ | Zumiez, Inc. | 32.86 | 0.0 | 845 | 15.4 | 0.0 | 1.17 |
| PLCE | The Children's Place, Inc. | 93.77 | 2.3 | 1,458 | 22.5 | 50.9 | 0.96 |
| SBH | Sally Beauty Holdings, Inc. | 14.75 | 0.0 | 1,763 | 6.9 | 0.0 | 0.81 |
| MNRO | Monro, Inc. | 77.91 | 1.1 | 2,531 | 32.2 | 36.4 | 0.90 |
| GCO | Genesco, Inc. | 43.70 | 0.0 | 711 | 10.1 | 0.0 | 0.83 |
| SFM | Sprouts Farmers Markets, Inc. | 19.87 | 0.0 | 2,331 | 17.2 | 0.0 | 0.35 |
| GRUB | Grubhub, Inc. | 66.46 | 0.0 | 6,129 | 233.9 | 0.0 | 1.57 |
| DBI | Designer Brands, Inc. | 16.92 | 5.9 | 1,229 | 24.3 | 143.5 | 1.32 |
| CONN | Conn's, Inc. | 27.38 | 0.0 | 771 | 10.4 | 0.0 | 1.57 |
| SIG | Signet Jewelers Limited | 17.11 | 8.8 | 907 | -4.1 | -35.8 | 1.19 |
| GPI | Group 1 Automotive, Inc. | 89.16 | 1.2 | 1,630 | 11.0 | 13.0 | 0.87 |
| GME | GameStop Corp. | 4.62 | 0.0 | 468 | -0.4 | 0.0 | 1.16 |
| PETS | PetMed Express, Inc. | 17.96 | 6.0 | 362 | 12.0 | 72.1 | 0.67 |
| ODP | Office Depot, Inc. | 1.70 | 6.0 | 917 | 29.8 | 177.5 | 2.32 |
| BIG | Big Lots, Inc. | 23.06 | 5.2 | 899 | 7.5 | 38.9 | 0.96 |
| CRMT | America's Car-Mart, Inc. | 92.68 | 0.0 | 617 | 12.0 | 0.0 | 0.79 |
| LB | L Brands, Inc. | 18.65 | 6.3 | 5,254 | 9.0 | 56.6 | 1.05 |
| W | Wayfair, Inc. | 134.93 | 0.0 | 12,357 | -18.1 | 0.0 | 2.01 |
| HIBB | Hibbett Sports, Inc. | 18.29 | 0.0 | 316 | 12.4 | 0.0 | 0.51 |
| GRPN | Groupon, Inc. | 2.89 | 0.0 | 1,640 | 205.0 | 0.0 | 1.04 |
| M | Macy's, Inc. | 17.46 | 8.9 | 5,252 | 5.3 | 47.1 | 0.73 |
| ETSY | Etsy, Inc. | 56.66 | 0.0 | 11,768 | 61.3 | 0.0 | 2.02 |
| PRTY | Party City Holdco, Inc. | 6.25 | 0.0 | 584 | 5.2 | 0.0 | 0.91 |
| OLLI | Ollie's Bargain Outlet Holdings, Inc. | 63.17 | 0.0 | 4,015 | 28.7 | 0.0 | 0.98 |
| PSMT | PriceSmart, Inc. | 65.35 | 1.1 | 1,973 | 27.9 | 30.2 | 0.89 |
| SFIX | Stitch Fix, Inc. | 21.24 | 0.0 | 2,119 | 43.5 | 0.0 | 1.59 |
| ULTA | Ulta Beauty, Inc. | 226.16 | 0.0 | 13,309 | 19.0 | 0.0 | 0.96 |
| SSTK | Shutterstock, Inc. | 37.79 | 8.0 | 1,316 | 39.9 | 321.2 | 1.06 |
| CWH | Camping World Holdings, Inc. | 9.35 | 3.4 | 828 | -19.7 | -66.9 | 1.28 |
| FLWS | 1-800-FLOWERS.COM, Inc. | 14.98 | 0.0 | 966 | 27.6 | 0.0 | 1.22 |
| WMK | Weis Markets, Inc. | 40.38 | 3.0 | 1,090 | 17.5 | 53.0 | 0.36 |
| HZO | MarineMax, Inc. | 15.53 | 0.0 | 330 | 8.5 | 0.0 | 1.14 |
| SAH | Sonic Automotive, Inc. | 31.09 | 1.0 | 1,368 | 12.6 | 12.7 | 1.04 |
| QUOT | Quotient Technology, Inc. | 8.18 | 0.0 | 721 | -26.1 | 0.0 | 1.04 |
| IMKTA | Ingles Markets, Inc. | 42.00 | 1.6 | 595 | 10.5 | 16.4 | 0.68 |
| GPC | Genuine Parts Company | 98.05 | 3.1 | 14,246 | 18.2 | 57.0 | 0.86 |
| HD | The Home Depot, Inc. | 233.80 | 2.0 | 256,046 | 23.2 | 47.4 | 0.92 |
| LOW | Lowe's Companies, Inc. | 113.49 | 1.9 | 87,892 | 35.9 | 69.3 | 1.43 |
| CVS | CVS Health Corp. | 63.90 | 3.1 | 83,101 | 17.9 | 56.0 | 0.84 |
| JD | JD.com, Inc. | 31.07 | 0.0 | 45,823 | 207.1 | 0.0 | 1.44 |
| BBBY | Bed Bath & Beyond Inc. | 10.75 | 6.4 | 1,360 | -2.6 | -16.3 | 1.50 |
| GPS | Gap, Inc. | 19.18 | 5.1 | 7,207 | 7.8 | 39.4 | 0.92 |
| Ticker | Name | Price | Dividend Yield | Market Cap ($M) | P/E Ratio | Payout Ratio | Beta |
This article will discuss our top 10-ranked retail stocks, according to the Sure Analysis Research Database. The stocks are ranked according to expected total returns over the next five years, listed in order of lowest to highest.
Table Of Contents
- Genuine Parts (GPC)
- Nordstrom Inc. (JWN)
- eBay Inc. (EBAY)
- The Gap (GPS)
- Kohl’s (KSS)
- CVS Health Corporation (CVS)
- Walgreens Boots Alliance (WBA)
- L Brands (LB)
- Abercrombie & Fitch (ANF)
- Bed Bath & Beyond (BBBY)
Top Retail Stock #10: Genuine Parts (GPC)
- Annualized 5-Year Expected Returns: 9.1%
Genuine Parts has retail exposure under its core NAPA automotive parts brand. It also has an industrial parts group and a business products segment. Its global span reaches throughout North America, Australia, New Zealand and Europe and is comprised of more than 3,100 locations.
The stock has a market capitalization of $14 billion, with nearly $20 billion in annual revenue.
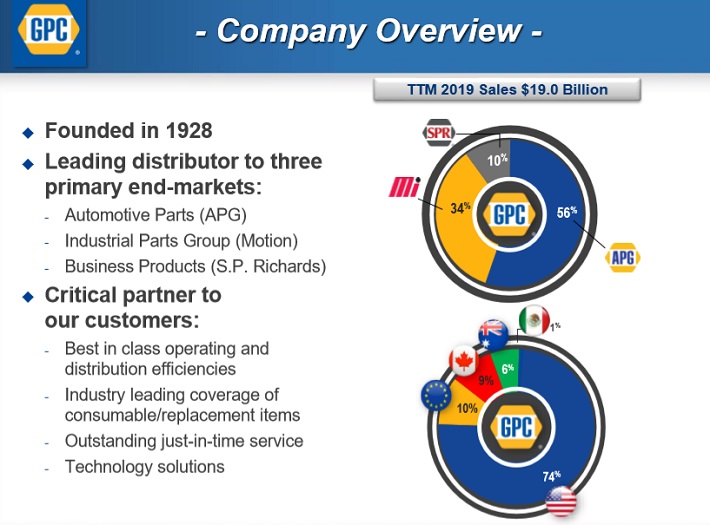
Source: Investor Presentation
In the most recent quarter, revenue of $4.9 billion increased 2.3% and reached a company record. This included a 1.6% comparable sales gain and 2.7% from acquisitions. However, these gains were partially offset by 1.5% in forex translation losses as well as a 0.5% decline from the disposition of the Grupo Auto Todo business in Q1.
Adjusting for acquisitions and divestitures, earnings-per-share were $1.57. Genuine Parts updated its guidance for ~5% sales growth this year and adjusted earnings-per-share of $5.65 to $5.75. We expect 6% annual EPS growth for Genuine Parts through 2024.
Current trends remain supportive of Genuine Parts’ growth. Specifically, consumers are keeping their cars longer and choosing to make minor repairs, rather than buy new cars. The average age of the U.S. car fleet is increasing. As average costs of vehicle repair increase as a car ages, this directly benefits Genuine Parts.
Genuine Parts deserves special commendation for its outstanding dividend history. It is a member of the exclusive Dividend Kings, a small group of stocks that have raised their dividends for at least 50 years in a row.
There are fewer than 25 Dividend Kings, one of which is industrial and auto parts giant Genuine Parts Company (GPC). Genuine Parts has increased its dividend for an amazing 63 years in a row.
We believe Genuine Parts’ dividend is highly secure, and is likely to continue growing in the years ahead. The following video further details our analysis of the company’s dividend:
Shares trade for a P/E ratio of 17, right on our fair value estimate. With a current dividend yield of 3.1%, and expected EPS growth of 6%, even with a flat valuation the stock is still expected to return 9.1% per year through 2024.
Top Retail Stock #9: Nordstrom Inc. (JWN)
- Annualized 5-Year Expected Returns: 9.5%
Nordstrom Inc. is a department store that sells clothes, shoes, and accessories. In some of its stores the company also offers items from the home furnishing and the wedding products categories. Nordstrom is currently valued at $5.3 billion. Nordstrom generates annual revenue of approximately $16 billion.
The company has a high-quality property portfolio. While Nordstrom is still highly reliant on malls, approximately 95% of its stores are located in malls rated A or better. Furthermore, all of Nordstrom’s stores are cash-flow positive.

Source: Investor Presentation
Nordstrom reported weak second-quarter earnings, leading to a guidance cut for revenue and earnings. Total consolidated net sales fell 5.1% in the second quarter. Digital sales were up 4% in Q2 and now represent 30% of the total business as Nordstrom continues its efforts to be a relevant e-commerce player, which appears to be working.
However, diluted earnings-per-share of $0.90 declined 5.2% from the year-ago quarter, as digital sales growth was not enough of an offset to declining total sales.
Over the last five years Nordstrom grew revenue by 5% per year. Growth has slowed more recently; revenue increased 2.3% in 2018, and is expected to decline in 2019. Margin erosion has further eroded profitability, as Nordstrom invests in new sales channels. That said, cost reductions of $150 million to $200 million annually and share buybacks will help keep EPS growth intact.
Nordstrom stock trades for a 2019 P/E of 10.4, which is below our fair value estimate of 12. Multiple expansion could fuel 2.9% annual returns for the stock. In addition to expected EPS growth (2%) and the 4.5% dividend yield, Nordstrom is expected to return 9.4% per year over the next five years.
Top Retail Stock #8: eBay Inc. (EBAY)
- Annualized 5-Year Expected Returns: 10.3%
eBay Inc. is a multinational e-commerce giant. The core eBay property brings buyers and sellers together in auction and fixed-price formats to buy and sell a wide variety of items worldwide. As of June 30th, eBay had 25 million active sellers, 182 million active buyers, and gross merchandise volume of $22.6 billion for the quarter.
The company provides several services including online auction style sales, instant shopping, online classified advertisements, online event ticket trading and other services. eBay has a market capitalization of approximately $34 billion, and generated $10.7 billion in revenue in 2018.
On July 17th, eBay reported second quarter results for the period ending in June 30, 2019. Revenue increased 4% compared to the same quarter last year on a currency-neutral basis, or 2% on an as-reported basis.
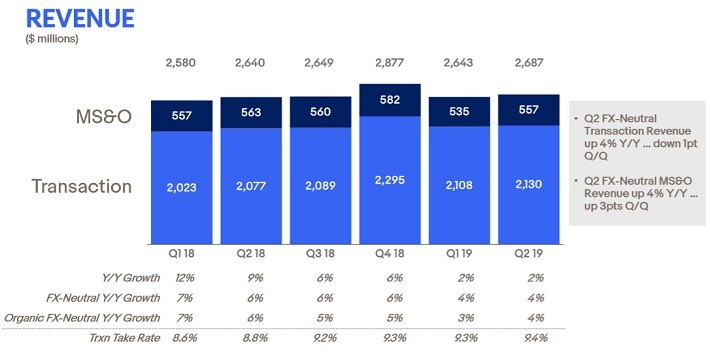
Source: Earnings Call
The company reported adjusted EPS of $0.68, which was a 27% increase from the same quarter in the year prior. Due to the strength of the second quarter, the company increased guidance to $10.75-$10.83 billion in revenue and $2.70-$2.75 in non-GAAP earnings-per-share for the full year.
From 2016 through 2019, eBay has had an average P/E of 17.7. However, during 2016 the market was adjusting to the new post-PayPal eBay company and during 2017 most tech stocks including eBay were in a strong bull market with high valuations. In 2018 and 2019, eBay has remained in a lower 14-15 P/E range. We consider a 15 P/E multiple to be fair, which is where the stock is currently trading.
Future returns will be comprised mainly of EPS growth (9%) and dividends (1.3%), leading to a total return estimate of 10.3% through 2024.
Top Retail Stock #7: The Gap (GPS)
- Annualized 5-Year Expected Returns: 10.4%
The Gap Inc. is a clothing and accessories retailer with a presence worldwide. The company has a market capitalization of $7.2 billion. The Gap operates 6 lines of business: Gap, Banana Republic, Old Navy, Intermix, Hill City, and Athleta.
On May 30, 2019, The Gap Inc. reported first quarter earnings of $0.24, on an adjusted basis. Comparable store sales fell 4%, inventory increased 10% and management guided for flat comparable store sales growth for the full year.
Management also announced plans to close 230 Gap specialty stores over the next two years, and expect a net closure of 30 stores for this year.
The Gap has had a difficult time adapting to the new retail environment. But the company is taking steps to streamline itself, improve operations, and maintain profitability. First, it is slimming down its operations by closing under-performing stores that have utilized excess resources. The Gap expects to close 230 Gap stores over the next two years, with a net closure of approximately 30 stores for 2019.
In addition, management reaffirmed its plan to spin off Old Navy in 2020.
Lastly, share buybacks will help keep EPS growth afloat. The Gap has announced plans to repurchase $200 million shares in fiscal year 2019, which is reflected in the 7.8 million shares reduction estimated from fiscal 2018.
The Gap remains profitable, and the stock appears to be significantly undervalued. In addition, the stock offers a high dividend yield of 5.1%, making it very attractive for income investors.
Based on expected EPS of $2.08 for 2019, shares of The Gap trade for a P/E ratio of 9, exactly equal to our fair value P/E. Total returns of 10.4% annually will be fueled by expected EPS growth of 5.3% per year, and the 5.1% dividend yield.
Top Retail Stock #6: Kohl’s (KSS)
- Annualized 5-Year Expected Returns: 11.5%
Kohl’s is a department store offering women’s, men’s and children’s apparel, housewares, accessories and footwear in more than 1,100 stores in 49 states. The stock has a market capitalization of $8.3 billion and the company generates sales of $19 billion per year.
Kohl’s reported fairly weak second-quarter earnings. Total revenue fell 3.1% to $4.43 billion, driven primarily by a 2.9% decline in comparable sales. Gross margins declined 72 basis points to 38.8%, as Kohl’s continues to struggle with assortment and inventory levels.
Diluted earnings-per-share declined 12% last quarter. Despite the decline, Kohl’s maintained its guidance range for this year. We continue to expect EPS of $5.30 for the full year, as Kohl’s believes it can still hit its earnings guidance for this year.
Over the past decade, shares of Kohl’s have routinely traded hands with an average multiple of about 13 times EPS. However, given the weak recent results we believe a slightly lower P/E ratio of 11 is fair value for Kohl’s. We see valuations in department store stocks continuing to decline, due to the broad industry challenges.
That said, we believe Kohl’s possesses multiple competitive advantages. It has a well-entrenched store footprint outside of large malls. It also has developed a large offering of private-label brands, a loyalty program, and an Amazon return service to drive traffic.
Kohl’s still appears undervalued. The stock trades for a P/E ratio of 9.8, meaning an expanding valuation multiple to 11 could add 2.3% to annual returns. In addition, Kohl’s has a high dividend yield of 5.2%. Combined with ~4% expected EPS growth, total returns are expected to reach 11.5% for Kohl’s.
Top Retail Stock #5: CVS Health Corporation (CVS)
- Annualized 5-Year Expected Returns: 12%
CVS Health Corporation is an integrated healthcare services provider that operates a pharmaceutical services business, along with the country’s largest chain of pharmacies. The company operates more than 9,900 retail locations, 1,100 medical clinics, and services more than 102 million plan members.
CVS generates annual revenues of $250 billion. Last year, CVS completed its massive acquisition of Aetna. The company expects $300 to $350 million in cost synergies this year with a total goal of $750 million in 2020.
The deal is transformational for CVS, as it opens up a great deal of new opportunities for the years ahead.
![]()
Source: Investor Day
CVS reported strong financial results for the 2019 second quarter. The company’s adjusted earnings-per-share was $1.89, which was $0.20 above estimates and a 12% increase from the previous year. Revenue grew 36% to $63.4 billion, which was $767 million above expectations. Excluding Aetna, revenues were flat from the previous year.
The Pharmacy Services segment had revenue growth of 4.2% due to increases in brand name drug prices, while a 4% increase in total pharmacy claims processed also boosted growth. Sales for the Retail/LTC segment increased 3.7% due to a 5.9% increase in prescriptions volumes and higher brand name drug prices.
CVS Health generated $4.8 billion in free cash flow during the quarter and $6 billion in free cash flow in the first half of the year. The company has used this to pay off debt, including paying off $1 billion in debt in the second quarter and another $1.5 billion in July.
Debt reduction is especially important due to the massive Aetna acquisition. CVS Health raised its guidance for adjusted earnings-per-share to a range of $6.89 to $7.00 for 2019, up from $6.75 to $6.90 previously. The midpoint of this guidance represents a decrease of 1.8% from 2018, due to integration costs of the Aetna deal.
CVS stock trades for a P/E ratio of 9.1, below our fair value P/E of 11. Expansion of the P/E ratio could add 3.9% to annual returns. In addition to expected EPS growth of 5% and the 3.1% dividend yield, we expect 12% total annual returns for CVS stock.
Top Retail Stock #4: Walgreens Boots Alliance (WBA)
- Annualized 5-Year Expected Returns: 14.6%
Walgreens Boots Alliance is a pharmacy retailer with over 18,000 stores in 11 countries. With 44 years of consecutive dividend increases, Walgreens is a member of the Dividend Aristocrats.
We believe Walgreens has one of the safest dividends in the retail industry. The following video discusses our analysis of Walgreens’ dividend in further detail:
In late June (6/27/19) Walgreens reported fiscal third-quarter financial results. Sales increased 0.7% (2.9% on a constant currency basis) to $34.6 billion compared to the same quarter last year.
Growth was attributable to the Retail Pharmacy USA division, which grew sales by 2.3%.
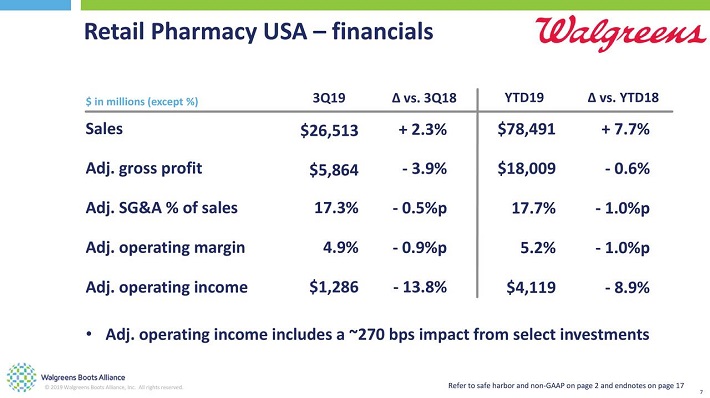
Source: Earnings Slides
Adjusted EPS fell 4.0% to $1.47, as the decline in net earnings was partially offset by a substantially lower share count.
Walgreens also reiterated its fiscal year 2019 outlook, indicating that adjusted earnings-per-share are anticipated to be roughly flat this year. This is down from previous guidance of 7% to 12% EPS growth.
Walgreens’ competitive advantage is its leading market share. Its robust retail presence and convenient locations encourage consumers to use Walgreens instead of its competitors. This brand strength means customers keep coming back to Walgreens, providing the company with stable sales and growth.
Despite its weak earnings report, Walgreens has a positive long-term growth outlook. This is because pharmacy retail has also proven to be resistant to e-commerce. Pharmacy retail will benefit from the aging U.S. population and rising demand for healthcare services.
In addition, the company is launching a cost management program that includes store closures. Walgreens already announced it will close 200 Boots stores in the U.K., and more recently announced the closure of 200 stores in the U.S. The company expects the U.S. store closures will deliver annual cost savings of at least $1.5 billion by 2022.
Walgreens is expected to generate earnings-per-share of $6.02 in fiscal 2019. The stock has a price-to-earnings ratio (P/E) of 9.6, well below our fair value estimate of 12.5.
Expansion of the price-to-earnings ratio could add 5.4% to Walgreens’ annual returns. In addition, we expect Walgreens to grow earnings by 6% per year, and the stock has a 3.2% dividend yield. Overall, Walgreens stock has expected returns of 14.6% per year over the next five years.
Top Retail Stock #3: L Brands (LB)
- Annualized 5-Year Expected Returns: 17.2%
L Brands is a specialty retailer with a variety of brands including the flagship Victoria’s Secret, as well as PINK and Bath & Body Works. L Brands operates more than 2,927 company-owned specialty stores and more than 650 franchised locations around the world.
On August 21st, L Brands announced Q2 fiscal year 2019 results. For the quarter L Brands reported revenue of $2.9 billion, a -2.8% decreased compared to the same quarter a year ago. A 10.1% increase in sales in the Bath & Body Works segment was offset by a 6.9% decline at Victoria Secret.
Bath & Body Works continues to be the saving grace for L Brands.
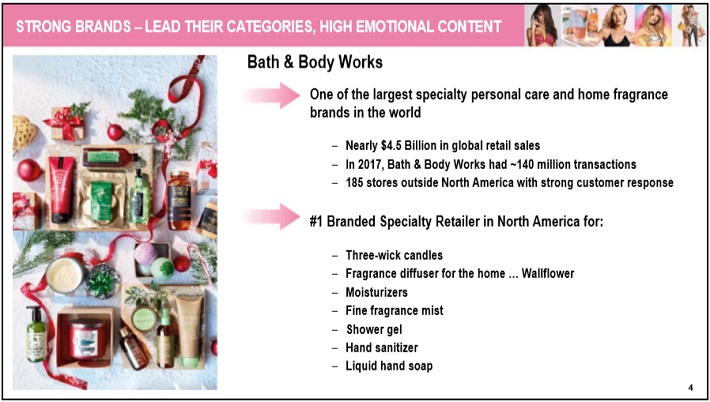
Source: Investor Handout
Net income came in at $37.6 million or $0.14 per share) compared to $99 million or $0.36 per share in the prior year period. However, results were skewed by a charge related to the early extinguishment of debt. Without this charge, net income would have been $67.6 million or $0.24 per share.
L Brands also updated its outlook for 2019. The company now expects full year earnings-per-share to be between $2.30 and $2.60, unchanged from previous guidance.
L Brands faces a bevy of concerns including the decline in mall traffic, being late to e-commerce, changing body image views, aggressive advertising without increased traffic, the rise in online shopping and two CEO departures (from the Victoria’s Secret and PINK segments). Further, the dividend was recently halved to $1.20 per share.
On the positive side, closing the unprofitable Henri Bendel business and generating a sale agreement for the La Senza segment could help L Brands focus on its Victoria’s Secret and Bath & Body Works core (which together already made up ~90% of sales).
Further, the dividend cut is bad news for current income investors but ought to help the company deleverage its balance sheet moving forward.
Overall, we are forecasting 3% annual growth as the company sees strong results from Bath & Body Works and continues to work on its turnaround story.
We have reduced our fair value P/E estimate to 11 to account for the company’s difficulties, a reasonable amount below its historical average P/E near 16 over the last decade. Still, given that the current P/E is 7.6, this could still imply significant upside of 7.7% per year through 2024.
With expected EPS growth of 3% per year and the 6.5% dividend yield, total returns could reach 17.2% per year over the next five years.
Top Retail Stock #2: Abercrombie & Fitch (ANF)
- Annualized 5-Year Expected Returns: 17.8%
Abercrombie & Fitch is a clothing retailer with nearly 900 stores globally, but focused mostly in the U.S. Abercrombie reported second-quarter earnings in late August. Net sales dipped by 0.2% to $841 million, but on a constant-currency basis increased 1% from the same quarter last year. Comparable sales came in flat from the year-ago period.
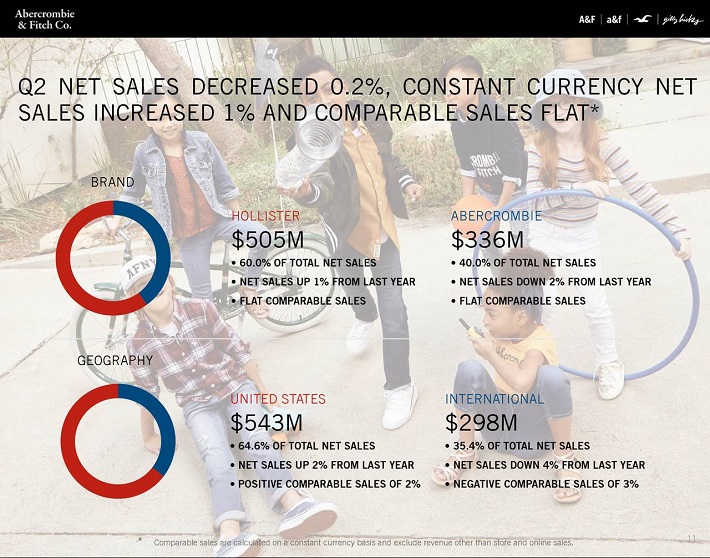
Source: Earnings Slides
Gross profit margin declined by 90 basis points, while the company reported an adjusted EPS loss of $0.48 per share. In the same quarter the previous year, the company generated positive adjusted EPS of $0.01. The reason for the loss was charges of $0.50 per share associated with store exits. Excluding this cost, Abercrombie’s adjusted EPS would have actually increased last quarter.
More troubling for investors was that Abercrombie lowered its full-year forecast. The company now expects full-year sales growth to be in the range of flat to up 2%, compared with prior expectations of 2% to 4% growth.
Still, we see the potential for high total returns, despite the guidance reduction. We are forecasting 5% earnings-per-share growth annually through 2024. Positive EPS growth is attainable through continued store openings, and to a lesser extent, comparable sales growth and cost cuts. Abercrombie is opening the equivalent of about 4% of its store base in new units annually, which should fuel sales growth.
Margin expansion is possible, as Abercrombie has done a nice job in recent quarters of keeping merchandise margins high with lower markdowns.
Abercrombie also pays a quarterly dividend of $0.20 per share. On an annual basis the $0.80 per share payout yields 4.7%. And with a 2019 expected payout ratio of less than 60%, we feel the dividend is sustainable barring a severe recession.
Lastly, the stock appears to be undervalued. Based on expected EPS of $1.40, shares of Abercrombie trade for a P/E ratio of 12.2. Our fair value estimate is a P/E ratio of 18, which is still under the historical average for this stock. An expanding P/E multiple could add 8.1% to the annual returns of the stock.
Putting it all together, Abercrombie could generate total returns of 17.8% per year through 2024.
Top Retail Stock #1: Bed Bath & Beyond (BBBY)
- Annualized 5-Year Expected Returns: 18.6%
The top stock according to expected returns through 2024 is Abercrombie & Fitch, although investors should note the stock also carries an elevated level of risk.
Bed Bath & Beyond is a diversified retailer with multiple brands including Bed Bath & Beyond, along with Christmas Tree Shops, Harmon, buybuy BABY, and World Market. As of June 1st 2019, the company had 1,536 stores across all 50 states, the District of Columbia, Puerto Rico and Canada including 995 Bed Bath & Beyond stores.
The past year has been very difficult for Bed Bath & Beyond. As a major brick-and-mortar retailer, it has struggled to compete with Internet retailers like Amazon. Bed Bath & Beyond is arguably among the hardest-hit physical retailers.
Bed Bath & Beyond has resorted to steep discounting to maintain traffic, including an aggressive couponing strategy, but this has simply lowered its profit margins in an already low-margin industry.
On July 10th, 2019 Bed Bath & Beyond reported Q1 fiscal year 2019 results for the period ending June 1st, 2019. For the quarter Bed Bath & Beyond recorded sales of $2.57 billion, representing a 6.6% decline compared to Q1 2018.
In response to the poor results, Bed Bath & Beyond has embarked on a multi-faceted turnaround strategy.
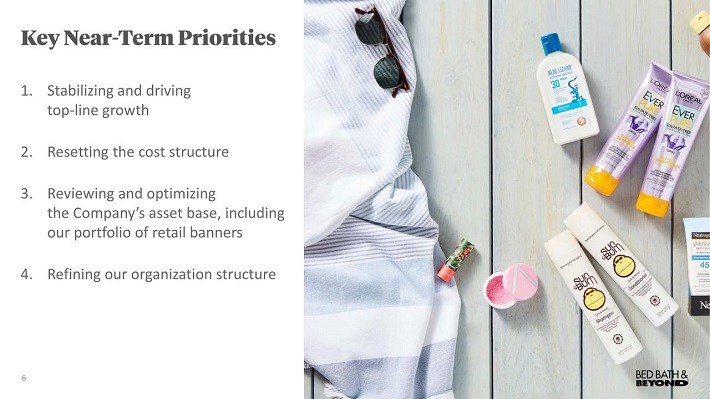
Source: Earnings Slides
Bed Bath & Beyond stock appears to be very attractive for its high return potential. However, there is also a heightened level of risk that the company will not successfully turn itself around.
Despite its falling sales, Bed Bath & Beyond remains profitable enough to pay a generous dividend to shareholders. Bed Bath & Beyond expects to generate adjusted EPS in a range of $2.11 to $2.20 per share for 2019, excluding impairment, severance and shareholder costs.
Bed Bath & Beyond shares trade for a P/E ratio of 5.1, a very low multiple that reflects the poor investor sentiment. Our fair value estimate is a P/E ratio of 8, which would boost annual returns by 9.4% per year through 2024.
The stock also has a dividend yield of 6.2% right now, making Bed Bath & Beyond a fairly attractive stock for income investors.
If Bed Bath & Beyond generates 3% annual EPS growth through 2024, total returns could reach 18.6% annually through 2024.
However, the long-term sustainability of the dividend could be in question if Bed Bath & Beyond does not reverse its recent fundamental deterioration. This means investors should view Bed Bath & Beyond as a high-risk, high-reward stock.
Final Thoughts
The retail industry is broadly struggling, as consumers are taking more of their shopping online. This trend should only accelerate in the future, meaning it is up to retailers to adapt. Many have done just that, by investing in their own e-commerce platforms and closing unprofitable stores.
While there are likely to be more retail bankruptcies in the future, those that remain will have even better growth opportunities with less competition. The retailers on this list are profitable, and continue to reward shareholders with dividends. Not only that, but their stocks appear to be undervalued.
The top two-ranked retailers are in significant turnarounds, which adds uncertainty. Investors should closely monitor their financial results in future quarters, to ensure their turnarounds are on track.