


Updated on October 11th, 2019 by Josh Arnold
In the world of investing, volatility matters. Investors are reminded of this every time there is a downturn in the broader market and individual stocks that are more volatile than others experience enormous swings in price.
Volatility is a proxy for risk; more volatility generally means a riskier portfolio. The volatility of a security or portfolio against a benchmark is called Beta.
In short, Beta is measured via a formula that calculates the price risk of a security or portfolio against a benchmark, which is typically the broader market as measured by the S&P 500.
Beta is helpful in understanding the overall price risk level for investors during market downturns in particular. The lower the Beta value, the less volatility the stock or portfolio should exhibit against the benchmark. This is beneficial for investors for obvious reasons, particularly those that are close to or already in retirement, as drawdowns should be relatively limited against the benchmark.
Importantly, low or high Beta simply measures the size of the moves a security makes; it does not mean necessarily that the price of the security stays nearly constant. Indeed, securities can be low Beta and still be caught in long-term downtrends, so this is simply one more tool investors can use when building a portfolio.
Here’s how to read stock betas:
- A beta of 1.0 means the stock moves equally with the S&P 500
- A beta of 2.0 means the stock moves twice as much as the S&P 500
- A beta of 0.0 means the stocks moves don’t correlate with the S&P 500
- A beta of -1.0 means the stock moves precisely opposite the S&P 500
Interestingly, low beta stocks have historically outperformed the market… But more on that later. You can download a spreadsheet of the 100 lowest beta stocks (as measured by 5 year beta) below:
Additionally, you can see the 100 lowest Beta stocks in the S&P 500 in the table below.
| FOXA | Fox Corp. | 30.52 | 0.0 | 18,941.66 | 11.9 | 0.0 | 0.15 |
| AMCR | Amcor Plc | 9.32 | 0.0 | 15,051.43 | 16.3 | 0.0 | -0.02 |
| DOW | Dow, Inc. | 44.92 | 0.0 | 33,385.08 | -0.13 | ||
| CTVA | Corteva, Inc. | 25.73 | 0.0 | 19,269.02 | -3.3 | 0.0 | 0.22 |
| NEM | Newmont Goldcorp Corp. | 38.94 | 1.4 | 31,926.67 | -286.3 | -411.8 | -0.06 |
| FOX | Fox Corp. | 30.42 | 0.0 | 18,879.60 | 11.9 | 0.0 | 0.17 |
| PSA | Public Storage | 246.70 | 3.2 | 43,073.33 | 29.4 | 95.4 | 0.11 |
| EVRG | Evergy, Inc. | 63.47 | 3.0 | 14,945.09 | 26.9 | 79.9 | 0.13 |
| AEP | American Electric Power Co., Inc. | 92.61 | 2.8 | 45,730.35 | 23.1 | 65.7 | 0.14 |
| WEC | WEC Energy Group, Inc. | 95.15 | 2.4 | 30,013.74 | 27.4 | 65.9 | 0.15 |
| DUK | Duke Energy Corp. | 96.29 | 3.9 | 70,156.99 | 21.2 | 81.9 | 0.15 |
| SO | The Southern Co. | 61.80 | 3.9 | 64,595.21 | 14.4 | 56.5 | 0.17 |
| ED | Consolidated Edison, Inc. | 93.05 | 3.1 | 30,906.00 | 22.0 | 68.8 | 0.16 |
| DTE | DTE Energy Co. | 130.29 | 2.9 | 23,882.42 | 21.5 | 61.2 | 0.17 |
| ETR | Entergy Corp. | 117.79 | 3.1 | 23,420.19 | 22.8 | 70.0 | 0.16 |
| D | Dominion Energy, Inc. | 81.78 | 4.3 | 67,216.21 | 54.9 | 235.2 | 0.18 |
| CMS | CMS Energy Corp. | 64.33 | 2.3 | 18,256.02 | 31.2 | 71.8 | 0.18 |
| ES | Eversource Energy | 85.54 | 2.4 | 27,680.92 | 31.6 | 76.7 | 0.18 |
| NEE | NextEra Energy, Inc. | 232.00 | 2.0 | 113,390.23 | 33.1 | 67.3 | 0.19 |
| PNW | Pinnacle West Capital Corp. | 95.37 | 3.0 | 10,710.43 | 21.3 | 64.8 | 0.21 |
| SJM | The J. M. Smucker Co. | 107.02 | 3.2 | 12,205.42 | 22.7 | 72.8 | 0.24 |
| XEL | Xcel Energy, Inc. | 63.95 | 2.5 | 32,934.95 | 26.1 | 64.1 | 0.22 |
| LNT | Alliant Energy Corp. | 53.49 | 2.6 | 12,705.00 | 24.7 | 63.8 | 0.21 |
| EXR | Extra Space Storage, Inc. | 116.28 | 3.0 | 15,748.09 | 34.2 | 102.5 | 0.22 |
| AWK | American Water Works Co., Inc. | 125.05 | 1.5 | 22,590.66 | 38.9 | 59.4 | 0.23 |
| EXC | Exelon Corp. | 47.42 | 3.0 | 46,072.51 | 20.2 | 60.3 | 0.24 |
| VTR | Ventas, Inc. | 73.13 | 4.3 | 27,247.14 | 52.4 | 227.0 | 0.26 |
| HSY | The Hershey Co. | 156.30 | 1.8 | 32,757.16 | 26.2 | 48.4 | 0.24 |
| AEE | Ameren Corp. | 76.85 | 2.4 | 18,889.96 | 23.7 | 58.0 | 0.25 |
| PEG | Public Service Enterprise Group, Inc. | 61.51 | 3.0 | 31,101.67 | 21.2 | 63.4 | 0.27 |
| NI | NiSource, Inc. | 29.01 | 2.7 | 10,830.80 | 95.1 | 259.0 | 0.27 |
| PPL | PPL Corp. | 30.56 | 5.4 | 22,071.87 | 12.4 | 66.7 | 0.30 |
| ATO | Atmos Energy Corp. | 110.85 | 1.9 | 13,102.58 | 26.2 | 48.6 | 0.27 |
| VZ | Verizon Communications, Inc. | 59.83 | 4.0 | 247,456.88 | 15.6 | 62.9 | 0.29 |
| HCP | HCP, Inc. | 36.55 | 4.0 | 17,950.07 | 17.7 | 71.8 | 0.28 |
| CBOE | Cboe Global Markets, Inc. | 117.08 | 1.1 | 13,075.73 | 32.2 | 34.2 | 0.33 |
| CPB | Campbell Soup Co. | 47.32 | 3.0 | 14,252.17 | 53.3 | 157.8 | 0.32 |
| FE | FirstEnergy Corp. | 47.90 | 3.1 | 25,865.38 | 23.0 | 71.2 | 0.31 |
| AMT | American Tower Corp. | 226.28 | 1.5 | 100,170.76 | 68.0 | 103.6 | 0.28 |
| LW | Lamb Weston Holdings, Inc. | 76.41 | 1.0 | 11,160.67 | 23.5 | 24.3 | 0.30 |
| GIS | General Mills, Inc. | 54.61 | 3.6 | 33,005.96 | 17.5 | 62.9 | 0.35 |
| WELL | Welltower, Inc. | 91.60 | 3.8 | 37,120.63 | 102.0 | 387.5 | 0.32 |
| SRE | Sempra Energy | 146.41 | 2.5 | 40,197.01 | 20.8 | 52.9 | 0.34 |
| CNP | CenterPoint Energy, Inc. | 28.16 | 4.0 | 14,142.49 | 24.7 | 98.9 | 0.35 |
| O | Realty Income Corp. | 78.73 | 3.4 | 25,054.09 | 60.1 | 204.4 | 0.33 |
| AZO | AutoZone, Inc. | 1,077.23 | 0.0 | 25,894.45 | 16.6 | 0.0 | 0.37 |
| EQR | Equity Residential | 88.16 | 2.5 | 32,694.40 | 51.0 | 128.0 | 0.34 |
| ESS | Essex Property Trust, Inc. | 330.98 | 2.3 | 21,754.65 | 53.2 | 122.5 | 0.35 |
| MKTX | MarketAxess Holdings, Inc. | 359.09 | 0.5 | 13,558.16 | 71.8 | 37.2 | 0.39 |
| K | Kellogg Co. | 62.37 | 3.6 | 21,245.22 | 24.8 | 88.9 | 0.40 |
| CME | CME Group, Inc. | 215.89 | 1.3 | 77,309.13 | 42.0 | 56.4 | 0.40 |
| MAA | Mid-America Apartment Communities, Inc. | 133.47 | 2.8 | 15,221.45 | 64.4 | 183.5 | 0.37 |
| CHD | Church & Dwight Co., Inc. | 75.63 | 1.2 | 18,687.87 | 30.8 | 36.3 | 0.34 |
| UDR | UDR, Inc. | 48.54 | 2.7 | 23,143.61 | 84.6 | 231.7 | 0.38 |
| AVB | AvalonBay Communities, Inc. | 218.68 | 2.7 | 30,540.19 | 33.1 | 90.5 | 0.39 |
| KMB | Kimberly-Clark Corp. | 137.89 | 2.9 | 47,461.74 | 26.4 | 77.8 | 0.40 |
| MKC | McCormick & Co., Inc. | 165.69 | 1.3 | 22,022.19 | 31.2 | 41.9 | 0.41 |
| MCD | McDonald's Corp. | 211.76 | 2.1 | 160,819.86 | 27.5 | 58.4 | 0.40 |
| KO | The Coca-Cola Co. | 53.66 | 2.9 | 229,451.77 | 32.6 | 96.1 | 0.41 |
| CLX | The Clorox Co. | 150.75 | 2.6 | 18,918.22 | 23.5 | 61.3 | 0.40 |
| CCI | Crown Castle International Corp. | 138.22 | 3.2 | 57,465.66 | 79.6 | 254.9 | 0.40 |
| HRL | Hormel Foods Corp. | 41.67 | 2.0 | 22,250.53 | 22.6 | 44.3 | 0.45 |
| AIV | Apartment Investment & Management Co. | 53.31 | 3.0 | 7,937.01 | 23.3 | 69.0 | 0.43 |
| PEP | PepsiCo, Inc. | 137.89 | 2.7 | 192,277.95 | 15.6 | 42.7 | 0.47 |
| RSG | Republic Services, Inc. | 86.87 | 1.7 | 27,863.64 | 26.7 | 46.2 | 0.46 |
| TSN | Tyson Foods, Inc. | 82.13 | 1.8 | 24,201.74 | 13.4 | 24.4 | 0.47 |
| FRT | Federal Realty Investment Trust | 134.43 | 3.0 | 10,160.38 | 40.7 | 123.6 | 0.46 |
| SYY | Sysco Corp. | 78.23 | 2.0 | 40,054.31 | 24.1 | 47.1 | 0.46 |
| PG | Procter & Gamble Co. | 121.94 | 2.4 | 305,170.70 | 83.5 | 198.5 | 0.47 |
| REG | Regency Centers Corp. | 68.30 | 3.3 | 11,468.04 | 39.9 | 133.1 | 0.47 |
| SBAC | SBA Communications Corp. | 242.82 | 0.0 | 27,464.40 | 211.1 | 0.0 | 0.45 |
| KHC | The Kraft Heinz Co. | 26.94 | 7.6 | 32,866.53 | -3.0 | -22.5 | 0.50 |
| EIX | Edison International | 74.19 | 3.3 | 26,566.70 | -97.5 | -320.8 | 0.50 |
| PM | Philip Morris International, Inc. | 77.75 | 5.9 | 120,966.56 | 15.5 | 90.7 | 0.53 |
| SPG | Simon Property Group, Inc. | 147.19 | 5.5 | 97,561.38 | 21.0 | 115.6 | 0.52 |
| WM | Waste Management, Inc. | 117.44 | 1.7 | 49,821.81 | 28.4 | 47.3 | 0.52 |
| DLR | Digital Realty Trust, Inc. | 130.65 | 3.2 | 27,220.01 | 119.7 | 383.0 | 0.52 |
| MO | Altria Group, Inc. | 42.98 | 7.4 | 80,290.94 | 12.8 | 95.0 | 0.55 |
| RE | Everest Re Group Ltd. | 249.50 | 2.2 | 10,164.63 | 19.6 | 43.2 | 0.51 |
| MDLZ | Mondelez International, Inc. | 55.41 | 1.9 | 79,909.53 | 21.7 | 40.8 | 0.55 |
| JNJ | Johnson & Johnson | 129.06 | 2.8 | 340,611.28 | 21.1 | 59.7 | 0.54 |
| IRM | Iron Mountain, Inc. | 32.30 | 7.5 | 9,273.56 | 31.7 | 237.5 | 0.53 |
| CL | Colgate-Palmolive Co. | 70.77 | 2.4 | 60,721.08 | 26.9 | 64.2 | 0.55 |
| YUM | Yum! Brands, Inc. | 114.33 | 1.4 | 34,789.02 | 26.7 | 36.4 | 0.55 |
| EQIX | Equinix, Inc. | 572.20 | 1.7 | 48,533.43 | 94.3 | 156.2 | 0.56 |
| ARE | Alexandria Real Estate Equities, Inc. | 154.13 | 2.5 | 17,570.05 | 44.0 | 110.4 | 0.56 |
| DRE | Duke Realty Corp. | 33.33 | 2.5 | 12,151.68 | 51.8 | 131.2 | 0.55 |
| KR | The Kroger Co. | 23.84 | 2.4 | 19,110.64 | 11.6 | 28.3 | 0.58 |
| WMT | Walmart, Inc. | 119.61 | 1.8 | 340,204.33 | 26.8 | 47.1 | 0.59 |
| TAP | Molson Coors Brewing Co. | 55.72 | 2.9 | 12,051.72 | 13.5 | 39.6 | 0.61 |
| COG | Cabot Oil & Gas Corp. | 17.51 | 1.7 | 7,326.03 | 8.9 | 14.7 | 0.59 |
| VNO | Vornado Realty Trust | 62.19 | 4.1 | 11,866.66 | 4.1 | 17.1 | 0.59 |
| ORLY | O'Reilly Automotive, Inc. | 398.80 | 0.0 | 30,513.38 | 23.5 | 0.0 | 0.61 |
| HRB | H&R Block, Inc. | 23.63 | 4.3 | 4,743.01 | 11.2 | 47.9 | 0.64 |
| ICE | Intercontinental Exchange, Inc. | 94.74 | 1.1 | 53,093.72 | 26.6 | 28.9 | 0.62 |
| CB | Chubb Ltd. | 155.39 | 1.9 | 70,818.84 | 18.9 | 35.8 | 0.60 |
| DLTR | Dollar Tree, Inc. | 113.91 | 0.0 | 26,953.95 | -17.2 | 0.0 | 0.64 |
| LHX | L3Harris Technologies, Inc. | 209.93 | 1.3 | 46,725.17 | 26.1 | 34.1 | 0.58 |
| PHM | PulteGroup, Inc. | 36.95 | 1.1 | 10,132.39 | 11.2 | 12.7 | 0.64 |
| CTXS | Citrix Systems, Inc. | 96.96 | 1.1 | 12,692.26 | 24.4 | 26.5 | 0.63 |
| Ticker | Name | Price | Dividend Yield | Market Cap ($M) | P/E Ratio | Payout Ratio | Beta |
Table of Contents
- The Evidence for Low Beta Outperformance
- How To Calculate Beta
- Beta & The Capital Asset Pricing Model (CAPM)
- Analysis On 5 Of The Best Low Beta High Dividend Stocks
- Final Thoughts
The Evidence for Low Beta Outperformance
The conventional wisdom would suggest that lower Beta stocks should underperform the broader markets during uptrends and outperform during downtrends, offering investors lower prospective returns in exchange for lower risk.
However, history would suggest that simply isn’t the case. Indeed, this paper from Harvard Business School suggests that not only do low Beta stocks not underperform the broader market over time – including all market conditions – they actually outperform.
A long-term study wherein the stocks with the lowest 30% of Beta scores in the US were pitted against stocks with the highest 30% of Beta scores suggested that low Beta stocks outperform by several percentage points annually.
Over time, this sort of outperformance can mean the difference between a comfortable retirement and having to continue working. While low Beta stocks aren’t a panacea, the case for their outperformance over time – and with lower risk – is quite compelling.
How To Calculate Beta
The formula to calculate a security’s Beta is fairly straightforward. The result, expressed as a number, shows the security’s tendency to move with the benchmark.
For example, a Beta value of 1.0 means that the security in question should move in lockstep with the benchmark. A Beta of 2.0 means that moves in the security should be twice as large in magnitude as the benchmark and in the same direction, while a negative Beta means that movements in the security and benchmark tend to move in opposite directions or are negatively correlated. In other words, negatively correlated securities would be expected to rise when the overall market falls, or vice versa. A small value of Beta (something less than 1.0) indicates a stock that moves in the same direction as the benchmark, but with smaller relative changes.
Here’s a look at the formula:
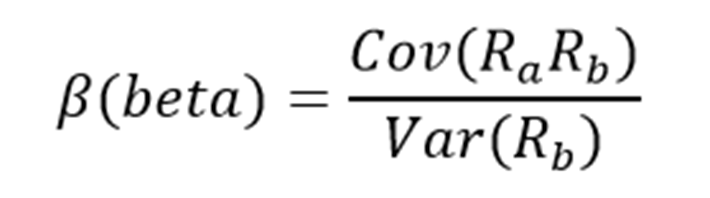
The numerator is the covariance of the asset in question with the market, while the denominator is the variance of the market. These complicated-sounding variables aren’t actually that difficult to compute – especially in Excel.
Additionally, Beta can also be calculated as the correlation coefficient of the security in question and the market, multiplied by the security’s standard deviation divided by the market’s standard deviation.
Finally, there’s a greatly simplified way to calculate Beta by manipulating the capital asset pricing model formula (more on Beta and the capital asset pricing model later in this article).
Here’s an example of the data you’ll need to calculate Beta:
- Risk-free rate (typically Treasuries at least two years out)
- Your asset’s rate of return over some period (typically one year to five years)
- Your benchmark’s rate of return over the same period as the asset
To show how to use these variables to do the calculation of Beta, we’ll assume a risk-free rate of 2%, our stock’s rate of return of 7% and the benchmark’s rate of return of 8%.
You start by subtracting the risk-free rate of return from both the security in question and the benchmark. In this case, our asset’s rate of return net of the risk-free rate would be 5% (7% – 2%). The same calculation for the benchmark would yield 6% (8% – 2%).
These two numbers – 5% and 6%, respectively – are the numerator and denominator for the Beta formula. Five divided by six yields a value of 0.83, and that is the Beta for this hypothetical security. On average, we’d expect an asset with this Beta value to be 83% as volatile as the benchmark. Thinking about it another way, this asset should be about 17% less volatile than the benchmark while still having its expected returns correlated in the same direction.
Beta & The Capital Asset Pricing Model (CAPM)
The Capital Asset Pricing Model, or CAPM, is a common investing formula that utilizes the Beta calculation to account for the time value of money as well as the risk-adjusted returns expected for a particular asset.
Beta is an essential component of the CAPM because without it, riskier securities would appear more favorable to prospective investors as their risk wouldn’t be accounted for in the calculation.
The CAPM formula is as follows:

The variables are defined as:
- ERi = Expected return of investment
- Rf = Risk-free rate
- βi = Beta of the investment
- ERm = Expected return of market
The risk-free rate is the same as in the Beta formula, while the Beta that you’ve already calculated is simply placed into the CAPM formula. The expected return of the market (or benchmark) is placed into the parentheses with the market risk premium, which is also from the Beta formula. This is the expected benchmark’s return minus the risk-free rate.
To continue our example, here is how the CAPM actually works:
ER = 2% + 0.83(8% – 2%)
In this case, our security has an expected return of 6.98% against an expected benchmark return of 8%. That may be okay depending upon the investor’s goals as the security in question should experience less volatility than the market thanks to its Beta of less than 1. While the CAPM certainly isn’t perfect, it is relatively easy to calculate and gives investors a means of comparison between two investment alternatives.
Now, we’ll take a look at five stocks that not only offer investors low Beta scores, but attractive prospective returns as well.
Analysis On 5 Of The Best Low Beta High Dividend Stocks
The following 5 stocks have the lowest (but positive) Beta values. We focused on Betas above 0, as we are still looking for stocks that are positively correlated with the broader market:
Public Storage (PSA) is a Real Estate Investment Trust that owns about 2,400 storage leasing properties, the largest such entity in the US. It has a market capitalization of $43 billion. The trust has grown its FFO-per-share over time, even though that growth has been lumpy. We see 3% FFO growth annually in the coming years as saturation is becoming a problem in the storage business. Shares trade for 22.9 times this year’s FFO-per-share, which is somewhat in excess of our fair value estimate of 20 times FFO. The current yield, modest growth, and a headwind from the valuation declining over time should combine for just 3.6% total annual returns. The stock offers investors a dividend yield of 3.3% and a 5-year Beta score of 0.12.
Click here to see our Sure Analysis Research Report on Public Storage.
Evergy Inc. (EVRG) is an electric utility that provides service to 1.6 million customers in Kansas and Missouri. We see earnings-per-share growth at 4%, the combination of share repurchases and revenue growth from customer base expansion and rate case increases. The stock is slightly overvalued at 21.9 times this year’s earnings, which compares somewhat unfavorably to our fair value estimate of 19 times earnings. The combination of earnings growth, dividends, and a small headwind from the valuation declining over time should combine for ~4.1% total annual returns in the coming years. Evergy currently has a 3.0% dividend yield and a 5-year Beta of 0.13.
American Electric Power (AEP) is one of the largest regulated utilities in the U.S., offering generation, distribution, and transmission to customers in 11 states. The company’s major growth driver moving forward will be its renewable power business, focusing on wind power. We see 5% earnings-per-share growth annually in the coming years, fueled by its renewable business as well as slow-but-steady growth from its traditional electric power customer base. Shares trade for 22.6 times this year’s earnings, somewhat in excess of our fair value estimate of 20 times earnings. Valuation changes, the dividend yield, and earnings growth should combine for ~5.4% total returns annually in the next five years. The stock offers a 2.9% dividend yield and has a 5-year Beta of 0.15.
Click here to see our Sure Analysis Research Report on American Electric Power.
WEC Energy Group (WEC) provides electric, gas, and steam power service to customers in Wisconsin, as well as gas service in three additional states. The company has moved heavily into non-traditional, unregulated utility projects in recent years, allowing it to grow more quickly than a regulated utility. We see 5.2% annual earnings-per-share growth coming in the next few years, driven by traditional, regulated utility growth, as well as its unregulated renewable energy business. Shares trade for 27 times this year’s earnings, well in excess of our fair value estimate of 17.2 times earnings. The combination of the overvaluation, the yield, and projected earnings growth should combine to create slightly negative total annual returns in the coming years of -0.7%, however. WEC offers a 2.5% dividend yield 5-year Beta score is 0.17.
Click here to see our Sure Analysis Research Report on WEC Energy Group.
Duke Energy Corporation (DUK) is one of the largest power providers in the US, producing $25 billion in annual revenue and sporting a $70 billion market capitalization. We see Duke growing earnings-per-share at 4% annually in the coming years, fueled by the company’s enormous capital expenditure plans, as well as its legacy regulated utility business. Like the other utility stocks in this list, Duke trades in excess of our fair value estimate. Shares are at 19.3 times earnings against our fair value estimate of 17 times earnings, meaning shareholders should see a minor headwind to total returns. The yield and earnings growth will overcome this headwind, combining for ~5.2% total returns annually. The stock’s current yield is 3.9% and its 5-year Beta score is 0.17.
Click here to see our Sure Analysis Research Report on Duke Energy Corporation.
Final Thoughts
Investors must take risk into account when selecting from prospective investments. After all, if two securities are otherwise similar in terms of expected returns but one offers a much lower Beta, the investor would do well to select the low Beta security as it would offer better risk-adjusted returns.
Using Beta can help investors determine which securities will produce more volatility than the broader market and which ones may help diversify a portfolio, such as the ones listed here.
The five stocks we’ve looked at not only offer low Beta scores, but they also offer attractive dividend yields. Sifting through the immense number of stocks available for purchase to investors using criteria like these can help investors find the best stocks to suit their needs.