


Updated on October 11th, 2019 by Josh Arnold
Spreadsheet data updated daily, constituents updated quarterly
In the world of investing, volatility matters.
Investors are reminded of this every time there is a downturn in the broader market and individual stocks that are more volatile than others experience enormous swings in price in both directions. That volatility can increase the risk in an individual’s stock portfolio relative to the broader market.
The volatility of a security or portfolio against a benchmark – is called Beta. In short, Beta is measured via a formula that calculates the price risk of a security or portfolio against a benchmark, which is typically the broader market as measured by the S&P 500 Index.
It is helpful in understanding the overall price risk level for investors during market downturns in particular. The higher the Beta value, the more volatility the stock or portfolio should exhibit against the benchmark. This can be beneficial for those investors that prefer to take a bit more risk in the market as stocks that are more volatile – that is, those with higher Beta values – should outperform the benchmark (in theory) during bull markets.
However, Beta works both ways and can certainly lead to larger drawdowns during periods of market weakness. Importantly, Beta simply measures the size of the moves a security makes.
High Beta stocks are not a sure bet during bull markets to outperform, so investors should be judicious when adding high Beta stocks to a portfolio, as the weight of the evidence suggests they are more likely to underperform during periods of market weakness.
However, for those investors interested in adding a bit more risk to their portfolio, we’ve put together a list to help investors find the best high beta stocks.
Additionally, you can see the 100 highest Beta stocks in the S&P 500 in the table below.
| AMD | Advanced Micro Devices, Inc. | 28.38 | 0.0 | 30,807.91 | 151.3 | 0.0 | 2.36 |
| NVDA | NVIDIA Corp. | 183.03 | 0.3 | 111,465.27 | 40.6 | 14.0 | 2.11 |
| URI | United Rentals, Inc. | 113.32 | 0.0 | 8,744.09 | 8.4 | 0.0 | 1.92 |
| MU | Micron Technology, Inc. | 43.28 | 0.0 | 47,772.46 | 7.7 | 0.0 | 1.94 |
| NFLX | Netflix, Inc. | 280.48 | 0.0 | 122,803.96 | 106.2 | 0.0 | 1.69 |
| TWTR | Twitter, Inc. | 39.54 | 0.0 | 30,565.13 | 12.8 | 0.0 | 1.70 |
| WDC | Western Digital Corp. | 57.34 | 3.5 | 17,043.86 | -22.1 | -77.2 | 1.80 |
| IPGP | IPG Photonics Corp. | 129.96 | 0.0 | 6,913.87 | 22.8 | 0.0 | 1.78 |
| WYNN | Wynn Resorts Ltd. | 106.06 | 3.1 | 11,413.75 | 13.7 | 42.0 | 1.77 |
| AMZN | Amazon.com, Inc. | 1,720.26 | 0.0 | 850,936.93 | 69.7 | 0.0 | 1.68 |
| ADSK | Autodesk, Inc. | 144.73 | 0.0 | 31,780.97 | 561.0 | 0.0 | 1.63 |
| ANET | Arista Networks, Inc. | 227.72 | 0.0 | 17,453.44 | 23.7 | 0.0 | 1.59 |
| ADBE | Adobe, Inc. | 274.98 | 0.0 | 133,486.02 | 48.2 | 0.0 | 1.61 |
| ALGN | Align Technology, Inc. | 194.17 | 0.0 | 15,508.55 | 37.2 | 0.0 | 1.57 |
| HES | Hess Corp. | 65.91 | 1.5 | 20,068.34 | -411.9 | -625.0 | 1.56 |
| MRO | Marathon Oil Corp. | 11.40 | 1.8 | 9,166.08 | 9.7 | 16.9 | 1.53 |
| SIVB | SVB Financial Group | 192.44 | 0.0 | 9,918.17 | 8.8 | 0.0 | 1.58 |
| CRM | salesforce.com, inc. | 146.41 | 0.0 | 114,035.53 | 118.7 | 0.0 | 1.54 |
| XLNX | Xilinx, Inc. | 92.81 | 1.6 | 23,444.27 | 25.0 | 39.0 | 1.59 |
| DVN | Devon Energy Corp. | 20.83 | 1.6 | 8,419.49 | 2.6 | 4.2 | 1.54 |
| AMAT | Applied Materials, Inc. | 51.01 | 1.6 | 47,120.69 | 16.8 | 27.0 | 1.54 |
| XEC | Cimarex Energy Co. | 44.86 | 1.7 | 4,551.36 | 7.2 | 12.3 | 1.57 |
| FLS | Flowserve Corp. | 43.63 | 1.7 | 5,722.95 | 27.6 | 48.1 | 1.53 |
| AAL | American Airlines Group, Inc. | 27.18 | 1.5 | 12,102.47 | 8.2 | 12.0 | 1.50 |
| AAPL | Apple, Inc. | 230.09 | 1.3 | 1,039,818.13 | 19.4 | 25.0 | 1.51 |
| NKTR | Nektar Therapeutics | 16.13 | 0.0 | 2,827.17 | -6.6 | 0.0 | 1.56 |
| NTAP | NetApp, Inc. | 49.78 | 3.4 | 11,843.31 | 12.5 | 42.2 | 1.49 |
| NBL | Noble Energy, Inc. | 20.12 | 2.2 | 9,622.45 | -10.4 | -23.4 | 1.53 |
| LRCX | Lam Research Corp. | 234.62 | 1.9 | 33,980.95 | 16.3 | 30.6 | 1.52 |
| MCHP | Microchip Technology, Inc. | 92.41 | 1.6 | 21,997.65 | 58.9 | 92.9 | 1.58 |
| ABMD | ABIOMED, Inc. | 162.34 | 0.0 | 7,366.50 | 28.4 | 0.0 | 1.50 |
| KLAC | KLA Corp. | 157.40 | 1.9 | 24,942.08 | 20.8 | 39.7 | 1.48 |
| ISRG | Intuitive Surgical, Inc. | 511.23 | 0.0 | 58,920.79 | 48.5 | 0.0 | 1.51 |
| FCX | Freeport-McMoRan, Inc. | 8.96 | 2.2 | 12,999.97 | 20.1 | 45.0 | 1.56 |
| SWKS | Skyworks Solutions, Inc. | 84.89 | 1.8 | 14,575.87 | 16.1 | 28.8 | 1.52 |
| ILMN | Illumina, Inc. | 298.18 | 0.0 | 43,832.46 | 46.7 | 0.0 | 1.51 |
| QRVO | Qorvo, Inc. | 76.80 | 0.0 | 9,045.89 | 46.3 | 0.0 | 1.50 |
| AMP | Ameriprise Financial, Inc. | 134.01 | 2.7 | 17,537.89 | 9.7 | 26.7 | 1.46 |
| KEYS | Keysight Technologies, Inc. | 94.43 | 0.0 | 17,712.99 | 56.9 | 0.0 | 1.49 |
| DXC | DXC Technology Co. | 26.59 | 2.9 | 6,965.57 | 6.3 | 18.4 | 1.49 |
| SWK | Stanley Black & Decker, Inc. | 140.43 | 1.9 | 21,309.27 | 29.4 | 55.3 | 1.49 |
| TRIP | TripAdvisor, Inc. | 37.83 | 0.0 | 5,269.72 | 38.4 | 0.0 | 1.43 |
| PYPL | PayPal Holdings, Inc. | 100.54 | 0.0 | 118,302.40 | 47.0 | 0.0 | 1.44 |
| MGM | MGM Resorts International | 27.43 | 1.8 | 14,302.74 | 79.3 | 144.6 | 1.45 |
| MYL | Mylan NV | 18.47 | 0.0 | 9,528.12 | 307.8 | 0.0 | 1.43 |
| ALXN | Alexion Pharmaceuticals, Inc. | 98.35 | 0.0 | 22,052.73 | 16.5 | 0.0 | 1.39 |
| MA | Mastercard, Inc. | 273.83 | 0.5 | 277,816.67 | 42.0 | 19.0 | 1.39 |
| CAT | Caterpillar, Inc. | 122.69 | 2.8 | 69,024.04 | 11.3 | 31.7 | 1.41 |
| CXO | Concho Resources, Inc. | 64.19 | 0.4 | 12,907.26 | 25.3 | 9.9 | 1.41 |
| ANSS | ANSYS, Inc. | 220.67 | 0.0 | 18,558.57 | 42.2 | 0.0 | 1.37 |
| MSFT | Microsoft Corp. | 139.10 | 1.3 | 1,062,085.53 | 27.2 | 36.0 | 1.37 |
| HFC | HollyFrontier Corp. | 53.17 | 2.5 | 8,750.61 | 9.8 | 24.4 | 1.38 |
| MXIM | Maxim Integrated Products, Inc. | 56.91 | 3.2 | 15,428.07 | 18.9 | 61.0 | 1.40 |
| PXD | Pioneer Natural Resources Co. | 129.35 | 0.4 | 21,620.08 | 24.3 | 9.0 | 1.34 |
| UAA | Under Armour, Inc. | 19.64 | 0.0 | 8,862.49 | 103.8 | 0.0 | 1.34 |
| APA | Apache Corp. | 20.43 | 4.9 | 7,680.84 | -10.9 | -53.5 | 1.34 |
| UA | Under Armour, Inc. | 17.85 | 0.0 | 8,054.76 | 94.3 | 0.0 | 1.35 |
| LNC | Lincoln National Corp. | 56.08 | 2.6 | 11,226.82 | 7.8 | 20.0 | 1.34 |
| INTU | Intuit, Inc. | 267.53 | 0.7 | 69,577.60 | 44.7 | 31.4 | 1.31 |
| MPC | Marathon Petroleum Corp. | 61.93 | 3.2 | 40,769.70 | 13.2 | 42.3 | 1.34 |
| TPR | Tapestry, Inc. | 24.99 | 5.4 | 7,192.87 | 11.2 | 60.7 | 1.29 |
| RHI | Robert Half International, Inc. | 53.04 | 2.2 | 6,235.44 | 13.8 | 30.7 | 1.34 |
| STX | Seagate Technology Plc | 52.90 | 4.8 | 13,973.27 | 7.4 | 35.1 | 1.40 |
| HPE | Hewlett-Packard Enterprise Co. | 14.11 | 3.2 | 18,422.02 | -136.1 | -433.9 | 1.33 |
| MSCI | MSCI, Inc. | 222.65 | 1.0 | 18,858.23 | 33.0 | 34.4 | 1.30 |
| PVH | PVH Corp. | 83.80 | 0.2 | 6,213.25 | 9.4 | 1.7 | 1.32 |
| FDX | FedEx Corp. | 141.36 | 1.8 | 36,882.24 | 82.8 | 152.3 | 1.33 |
| CDNS | Cadence Design Systems, Inc. | 65.54 | 0.0 | 18,361.23 | 42.1 | 0.0 | 1.32 |
| AVGO | Broadcom, Inc. | 274.45 | 3.5 | 108,866.36 | 37.0 | 130.8 | 1.30 |
| SNPS | Synopsys, Inc. | 138.22 | 0.0 | 20,772.67 | 32.9 | 0.0 | 1.31 |
| PH | Parker-Hannifin Corp. | 170.75 | 1.9 | 21,941.20 | 14.7 | 27.1 | 1.30 |
| ALB | Albemarle Corp. | 65.46 | 2.1 | 6,937.84 | 12.7 | 27.3 | 1.34 |
| CSCO | Cisco Systems, Inc. | 46.15 | 2.9 | 195,920.13 | 17.5 | 51.7 | 1.29 |
| FTNT | Fortinet, Inc. | 77.60 | 0.0 | 13,268.90 | 35.5 | 0.0 | 1.29 |
| WRK | WestRock Co. | 35.41 | 5.1 | 9,112.48 | 10.9 | 55.1 | 1.29 |
| TXN | Texas Instruments Incorporated | 127.73 | 2.3 | 119,251.28 | 22.9 | 52.6 | 1.32 |
| GLW | Corning, Inc. | 28.20 | 2.7 | 22,020.42 | 15.8 | 42.6 | 1.27 |
| CF | CF Industries Holdings, Inc. | 49.15 | 2.4 | 10,730.72 | 24.3 | 59.3 | 1.25 |
| FANG | Diamondback Energy, Inc. | 82.54 | 0.7 | 13,457.57 | 13.2 | 9.0 | 1.28 |
| DE | Deere & Co. | 167.80 | 1.8 | 52,835.69 | 16.1 | 28.5 | 1.30 |
| DISH | DISH Network Corp. | 33.15 | 0.0 | 16,339.68 | 10.9 | 0.0 | 1.28 |
| PKI | PerkinElmer, Inc. (United States) | 80.50 | 0.3 | 8,941.62 | 35.3 | 12.3 | 1.29 |
| ETFC | E*TRADE Financial Corp. | 38.96 | 1.1 | 9,343.15 | 9.5 | 10.3 | 1.27 |
| GOOG | Alphabet, Inc. | 1,208.67 | 0.0 | 838,117.50 | 24.2 | 0.0 | 1.27 |
| NOV | National Oilwell Varco, Inc. | 20.68 | 1.0 | 7,980.33 | -1.4 | -1.4 | 1.25 |
| TXT | Textron, Inc. | 47.46 | 0.2 | 10,921.69 | 9.5 | 1.6 | 1.26 |
| ATVI | Activision Blizzard, Inc. | 53.69 | 0.6 | 41,181.63 | 24.3 | 15.4 | 1.27 |
| GOOGL | Alphabet, Inc. | 1,209.47 | 0.0 | 838,672.24 | 24.2 | 0.0 | 1.27 |
| BWA | BorgWarner, Inc. | 35.40 | 1.9 | 7,310.63 | 9.6 | 18.4 | 1.25 |
| FTI | TechnipFMC Plc | 22.92 | 2.3 | 10,233.37 | -5.2 | -11.7 | 1.30 |
| HPQ | HP, Inc. | 16.03 | 3.9 | 23,755.02 | 5.9 | 22.6 | 1.24 |
| UNM | Unum Group | 27.54 | 3.8 | 5,745.70 | 11.1 | 41.8 | 1.26 |
| ADI | Analog Devices, Inc. | 108.44 | 1.9 | 40,058.39 | 26.5 | 49.9 | 1.29 |
| RCL | Royal Caribbean Cruises Ltd. | 103.61 | 2.7 | 21,712.62 | 11.7 | 31.7 | 1.26 |
| FB | Facebook, Inc. | 180.03 | 0.0 | 513,616.11 | 30.3 | 0.0 | 1.27 |
| PRGO | Perrigo Co. Plc | 52.00 | 1.5 | 7,074.86 | 80.7 | 121.1 | 1.30 |
| TDG | TransDigm Group, Inc. | 511.00 | 0.0 | 27,274.63 | 38.3 | 0.0 | 1.22 |
| TROW | T. Rowe Price Group, Inc. | 108.51 | 2.7 | 25,561.16 | 13.5 | 36.2 | 1.21 |
| EOG | EOG Resources, Inc. | 68.91 | 1.4 | 39,992.40 | 11.2 | 15.3 | 1.22 |
| AMG | Affiliated Managers Group, Inc. | 73.06 | 1.7 | 3,699.73 | -31.9 | -54.2 | 1.26 |
| Ticker | Name | Price | Dividend Yield | Market Cap ($M) | P/E Ratio | Payout Ratio | Beta |
Table of Contents
- High Beta Stocks Versus Low Beta Stocks
- How To Calculate Beta
- Beta & The Capital Asset Pricing Model (CAPM)
- Analysis On 5 Of The Best High Beta Stocks
- Final Thoughts
High Beta Stocks Versus Low Beta
Intuitively, it would make sense that high Beta stocks would outperform during bull markets. After all, these stocks should be achieving more than the benchmark’s returns given their high Beta values. While this can be true over short periods of time – particularly the strongest parts of the bull market – the high Beta names are generally the first to be sold heavily by investors.
This excellent paper from the CFA Institute theorizes that this is true because investors are able to use leverage to bid up momentum names with high Beta values and thus, on average, these stocks have lower prospective returns at any given time. In addition, leveraged positions are among the first to be sold by investors during weak periods because of margin requirements or other financing concerns that come up during bear markets. In other words, while high Beta names may outperform while the market is strong, as signs of weakness begin to show, high Beta names are the first to be sold and generally, much more strongly than the benchmark.
Indeed, evidence suggests that during good years for the market, high Beta names capture 138% of the market’s total returns. In other words, if the market returned 10% in a year, high Beta names would, on average, produce 13.8% returns. However, during down years, high Beta names capture 243% of the market’s returns. In a similar example, if the market lost 10% during a year, the group of high Beta names would have returned -24.3%. Given this relatively small outperformance during good times and vast underperformance during weak periods, it is easy to see why we prefer low Beta stocks.
While low Beta stocks aren’t a vaccine against downturns in the market, it is much easier to make the case over the long run for low Beta stocks versus high Beta given how each group performs during bull and bear markets.
How To Calculate Beta
The formula to calculate a security’s Beta is fairly straightforward. The result, expressed as a number, shows the security’s tendency to move with the benchmark.
In other words, a Beta value of 1.00 means that the security in question should move virtually in lockstep with the benchmark. A Beta of 2.00 means moves should be twice as large in magnitude while a negative Beta means that returns in the security and benchmark are negatively correlated; these securities tend to move in the opposite direction from the benchmark. This sort of security would be helpful to mitigate broad market weakness in one’s portfolio as negatively correlated returns would suggest the security in question would rise while the market falls.
For those investors seeking high Beta, stocks with values in excess of 1.3 would be the ones to seek out. These securities would offer investors at least 1.3X the market’s returns for any given period.
Here’s a look at the formula to compute Beta:
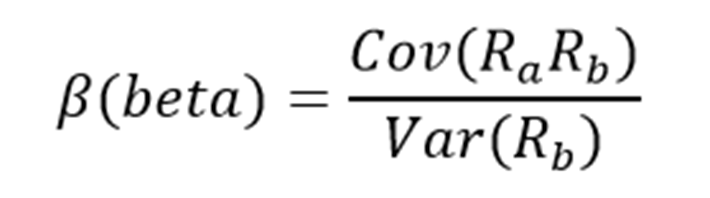
The numerator is the covariance of the asset in question while the denominator is the variance of the market. These complicated-sounding variables aren’t actually that difficult to compute.
Here’s an example of the data you’ll need to calculate Beta:
- Risk-free rate (typically Treasuries at least two years out)
- Your asset’s rate of return over some period (typically one year to five years)
- Your benchmark’s rate of return over the same period as the asset
To show how to use these variables to do the calculation of Beta, we’ll assume a risk-free rate of 2%, our stock’s rate of return of 14% and the benchmark’s rate of return of 8%.
You start by subtracting the risk-free rate of return from both the security in question and the benchmark. In this case, our asset’s rate of return net of the risk-free rate would be 12% (14% – 2%). The same calculation for the benchmark would yield 6% (8% – 2%).
These two numbers – 12% and 6%, respectively – are the numerator and denominator for the Beta formula. Twelve divided by six yields a value of 2.00, and that is the Beta for this hypothetical security. On average, we’d expect an asset with this Beta value to be 200% as volatile as the benchmark. Thinking about it another way, this asset should be about twice as volatile than the benchmark while still having its expected returns correlated in the same direction. That is, returns would be correlated with the market’s overall direction, but would return double what the market did during the period. This would be an example of a very high Beta stock and would offer a significantly higher risk profile than an average or low Beta stock.
Beta & The Capital Asset Pricing Model
The Capital Asset Pricing Model, or CAPM, is a common investing formula that utilizes the Beta calculation to account for the time value of money as well as the risk-adjusted returns expected for a particular asset. Beta is an essential component of the CAPM because without it, riskier securities would appear more favorable to prospective investors as their risk wouldn’t be accounted for in the calculation.
The CAPM formula is as follows:

The variables are defined as:
- ERi = Expected return of investment
- Rf = Risk-free rate
- βi = Beta of the investment
- ERm = Expected return of market
The risk-free rate is the same as in the Beta formula, while the Beta that you’ve already calculated is simply placed into the CAPM formula. The expected return of the market (or benchmark) is placed into the parentheses with the market risk premium, which is also from the Beta formula. This is the expected benchmark’s return minus the risk-free rate.
To continue our example, here is how the CAPM actually works:
ER = 2% + 2.00(8% – 2%)
In this case, our security has an expected return of 14% against an expected benchmark return of 8%. In theory, this security should vastly outperform the market to the upside but keep in mind that during downturns, the security would suffer significantly larger losses than the benchmark. Indeed, if we changed the expected return of the market to -8% instead of +8%, the same equation yields expected returns for our hypothetical security of -18%. This security would theoretically achieve stronger returns to the upside but certainly much larger losses on the downside, highlighting the risk of high Beta names during anything but strong bull markets. While the CAPM certainly isn’t perfect, it is relatively easy to calculate and gives investors a means of comparison between two investment alternatives.
Analysis On 5 Of The Best High Beta Stocks
Now, we’ll take a look at five stocks that offer investors high Beta scores as well as attractive prospective returns.
Advanced Micro Devices, Inc.
Advanced Micro Devices (AMD) is a chip maker that focuses on the lucrative but somewhat volatile gaming chip market. Advanced Micro Devices sports a $31 billion market capitalization. The company doesn’t pay a dividend and it also doesn’t buy back stock; indeed, it is a net issuer of stock over time. Despite this, its exposure to the bull market in chips is good for its earnings growth outlook, and we see 12% earnings-per-share growth annually in the coming years. However, with the current valuation of nearly 44 times this year’s earnings, we see essentially no total returns in the coming years. It is a highly volatile stock, as Advanced Micro Devices’ 5-year Beta value is 2.34. Click here to see a Sure Analysis report on Advanced Micro Devices, Inc.
NVIDIA Corporation
NVIDIA Corporation (NVDA) is a semiconductor company that designs and manufactures graphics processors, chipsets and related software. The company serves the gaming, artificial intelligence and autonomous vehicle markets, in addition to many others. NVIDIA pays a very small dividend, so it isn’t an income stock, but it does offer investors decent annual returns looking forward. NVIDIA’s estimated earnings growth of 15% annually will more than offset an ~8% headwind from the valuation moving lower over time. We estimate total returns – taking into account the diminutive yield – at 6% annually in the next five years. NVIDIA’s 5-year Beta score is 2.11. Click here to see a Sure Analysis report on NVIDIA.
United Rentals, Inc.
United Rentals (URI) is the largest equipment rental company in the world, serving a wide variety of business and consumer markets for equipment rentals. The company’s shares have fallen to 52-week lows after a full year of sharp rallies and declines. We see forward earnings growth at a modest 2% annually, but United Rentals shares are very cheap. The current price-to-earnings ratio is just 5.9 on this year’s earnings estimate of $19 per share, well below our fair value estimate of 10 times earnings. We see 13.5% total annual returns in the coming years as modest earnings growth and a valuation reset fuel shareholder returns. United Rentals does not pay a dividend. The stock’s 5-year Beta score is 1.89.
Micron Technology Inc.
Micron Technology (MU) is one of the top three producers of DRAM in the world, and is a top NAND producer as well. The company’s products are used in computers, servers, smartphones, and more. Micron has a $48 billion market capitalization. We see Micron as producing outstanding earnings growth in the coming years of 15% annually. Micron’s earnings volatility has been sizable over time, and we believe that will continue. But the company’s exposure the strong semiconductor cycle globally should serve it well. Micron doesn’t pay a dividend and the current valuation of 6.9 times earnings is right in line with out fair value estimate of 7 times earnings. We thus see total annual returns of 15.3% over the next five years, driven by revenue growth. Micron’s 5-year Beta value is 1.85. Click here to see a Sure Analysis report on Micron Technology Inc.
Netflix Inc.
Netflix Inc. is a media company that was once focused on mailing DVDs to customers. Today, Netflix is an online entertainment streaming giant that produces much of its own content, with ~150 million subscribers. We see the company producing 5.1% earnings growth annually as it continues to capitalize on the cord-cutting trend where consumers eschew traditional cable in favor of streaming services like Netflix. However, the stock is trading for 76 times this year’s earnings, well in excess of our still-lofty target of 50 times earnings. The headwind from the valuation resetting and earnings growth combine for estimate total returns of -3.3% annually. Netflix’ 5-year Beta value is also 1.71. Click here to see a Sure Analysis report on Netflix Inc.
Final Thoughts
Investors must take risk into account when selecting from prospective investments. After all, if two securities are otherwise similar in terms of expected returns but one offers a much lower Beta, the investor would do well to select the low Beta security as it would offer better risk-adjusted returns.
Using Beta can help investors determine which securities will produce more volatility than the broader market, such as the ones listed here. The five stocks we’ve looked at offer investors high Beta scores along with very strong prospective returns. For investors that want to take some additional risk in their portfolio, these names and others like them in our list of the 100 best high Beta stocks can help determine what to look for when selecting a high Beta stock to buy.