


Updated September 23rd, 2021 by Ben Reynolds
Originally published July 16th, 2016
The goal of rational investors is to maximize total return under a given set of constraints.
Constraints include:
- Risk tolerance
- Current income needs
- Ethical concerns (no tobacco stocks, as an example)
This article shows exactly how to calculate expected total returns.
Video Analysis
The following video provides a visual tutorial on how to calculate expected total returns, using the Dividend Aristocrat Coca-Cola (KO) as an example.
Note: The Dividend Aristocrats are an elite group of 65 stocks in the S&P 500 that have paid rising dividends for 25+ consecutive years.
What Is Total Return?
Total return is the complete return of an investment over a given time period. It includes all capital gains and any dividends or interest paid.
Total return differs from stock price growth because of dividends. The total return of a stock going from $10 to $20 is 100%.
The total return of a stock going from $10 to $20 and paying $1 in dividends is 110%.
It may seem simple at first glance, but total returns are one of the most important financial metrics around…
How-To Calculate Total Return
- Find the initial cost of the investment
- Find total amount of dividends or interest paid during investment period
- Find the closing sales price of the investment
- Add sum of dividends and/or interest to the closing price
- Divide this number by the initial investment cost and subtract 1
An example using the numbers from the dividend case in the ‘What Is Total Return’ section is below:
- $10
- $1
- $20
- $20 + $1 = $21
- $21 / $10 – 1 = 110%
How-To Estimate Future Total Return
Calculating total return after the fact is simple.
There’s money to be made in accurately estimating expected future total returns in the stock market.
To understand how to do this for stocks, we have to break total return down into its components.
- Dividends
- Change in share price
Change in share price comes from 2 sources.
- Change in earnings-per-share (or less commonly book value, revenue, etc.)
- Change in price-to-earnings multiple (or other valuation multiple)
Therefore, the 3 aspects of total return for stocks are:
- Dividends
- Change in earnings-per-share
- Change in price-to-earnings multiple
The formula for expected total return is below:
Expected total return = change in earnings-per-share x change in the price-to-earnings ratio
Note: We calculate expected total returns using the 3 aspects of total return for more than 700 securities in The Sure Analysis Research Database.
The rest of this article shows how to estimate expected total returns with a real-world example.
We will estimate future returns for Coca-Cola (KO) over the next 5 years.
Coca-Cola is used as an example because it is a relatively simple, predictable business. This makes it a good choice for learning how to calculate expected total returns. With that said, this method can be applied to any stock investment.
The further out in time one estimates, the less reliable the estimate. Estimates of Coca-Cola’s return over 1 year will likely be more accurate than estimates over 10 or 20 years because more can change in 10 or 20 years than in 1 year.
Estimating Valuation Multiple Changes
Note: Data for the example below is from July of 2016, when this article was originally published.
Coca-Cola currently trades for $45.63 per share. The company has $1.97 in adjusted earnings over the last 4 quarters for a price-to-earnings ratio of 23.2.
From 2006 through 2015 Coca-Cola had an average price-to-earnings ratio of 18.6. The company’s price-to-earnings multiple traded for an 8% premium to the S&P 500’s price-to-earnings multiple over this time period.
S&P 500 stocks very clearly overvalued from a historical perspective at current levels.
- S&P 500 price-to-earnings ratio of 25.0
- Historical average price-to-earnings ratio of 15.6
There are 2 questions surround Coca-Cola’s price-to-earnings ratio:
- Will it maintain its historical premium to the market in 5 years?
- Will the market still be overvalued in 5 years?
When one makes projections, one should always err on the side of conservatism.
Coca-Cola’s core soda business is experiencing headwinds in developed countries that are likely to persist indefinitely. On the other hand, the company is a market leader that still has growth potential internationally and with its still beverages. A price-to-earnings ratio in line with the S&P 500 is conservative, in my opinion, on balance.
The question of whether the market as a whole will be overvalued in 5 years is more difficult to answer. Low interest rates naturally lead to higher market values. Interest rates will very likely still be low 5 years from now.
Here are 3 different scenarios for the next 5 years:
- Market reverts to historical price-to-earnings ratio of 15.6
- Market maintains its current overvalued status at 25.0
- Market mediates to a price-to-earnings ratio of around 20
I believe that all 3 of these scenarios are about equally likely. The average of these scenarios is a price-to-earnings ratio of 20.2. We will use 20.2 as our expected price-to-earnings ratio for Coca-Cola 5 years in the future.
This is just guessing at the future however. Estimating a reliable price-to-earnings ratio into the future is error-prone.
The image below shows the company’s change in expected price-to-earnings ratio over the next 5 years:

The above assumes a compound price-to-earnings multiple growth rate of -2.7% per year. We can expect that valuation multiple changes will be a drag on Coca-Cola’s performance.
The steps to calculate valuation multiple changes are below:
- Find current price-to-earnings ratio
- Estimate expected future price-to-earnings ratio
- Calculate compound annual growth rate of price-to-earnings ratio
We are one third of the way done with our calculations.
Estimating Expected Growth Rate Part 1: Underlying Business Growth
Growth should be estimated on a per share basis.
Why? Because share buybacks and issuances matter. A brief example is below:
Imagine a business generated $1,000,000 a year and has 4 owners. This business is valued at a 10x earnings multiple. The whole business is worth $10,000,000. Your share of the business is worth $2,500,000 (lucky you!).
Now imagine that one of the owners wants to be ‘bought out’. The business uses cash on hand to buy out this owner. There are now only 3 owners left, and the business is still making $1,000,000 a year and has a 10x multiple.
Your share of the business has now gone up to $3,333,333 because you own 33% of it instead of 25%.
If new shares were issued, the opposite effect would have occurred; your shares would be worth less. Investors should always estimate growth on a per share basis.
Growth comes from 2 places for public businesses:
- Share repurchases
- Underlying business growth
First, we will calculate the expected growth of the business.
The company is expecting adjusted earnings in 2016 to be around flat after accounting for expected negative currency fluctuations of 8 to 9 percentage points.
We will assume currency fluctuations will be flat over the remainder of Coca-Cola’s 5 year projections.
Coca-Cola has grown profit at 5.2% a year over the last decade. The company has a number of favorable growth prospects working for it, as well as negative soda trends working against it in the developed world.
I expect the company to continue growing profit at around 5% a year going forward. This gives the company the following earnings expectations per year:

We can expect Coca-Cola’s underlying business to generate returns of 5% per year. This plus the company’s -2.7% per year price-to-earnings ratio compression means we are at expected total returns of around 2.3% a year before dividends and share repurchases.
Second, we need to calculate the amount of share repurchases.
Estimating Expected Growth Rate Part 2: Share Repurchases
The image below shows relevant numbers for Coca-Cola from 2006 through 2015. A 10 year period is chosen because it is long enough to cover a wide range of economic conditions, but short enough to cover fairly recent financial history.

Coca-Cola has historically spent 58% of its net income after dividends on share repurchases. The company is mature and doesn’t have significant growth projects that will eat up cash. I believe an 58% repurchase rate is the most likely outcome over the next 5 years.
We have estimated what percent of after dividend earnings Coca-Cola will spend on share buybacks. Next, we will assume that dividends grow in line with earnings over the next 5 years. This is a reasonable assumption given the maturity of Coca-Cola’s business.
The amount of cash the company will spend on buybacks is below, along with the percentage of share count reduction:
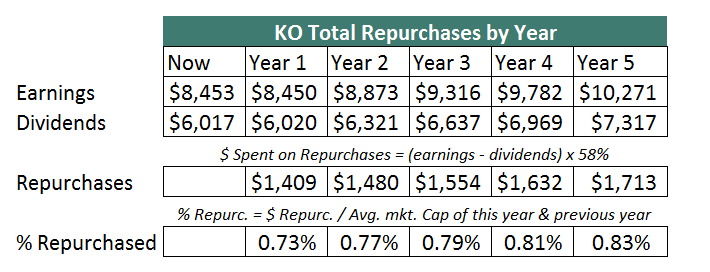
You can see that as the price-to-earnings ratio falls, the company is able to repurchase more shares each year. On average, share repurchases will contribute about 0.8 percentage points to total return a year over the next 5 years for Coca-Cola.
Related: Learn more about share repurchases in the video below.
Adding this to the company’s 2.3% total return we’ve calculated so far gives us an expected total return before dividends of 3.1% a year.
Estimating Dividend Payments
Coca-Cola currently has a dividend yield of 3.1%. The quick and (mostly) correct way to find the amount of return dividends will add to total return is to simply add the current dividend yield to our return numbers so far.
Adding Coca-Cola’s current dividend yield of 3.1% to the company’s 3.1% returns we’ve calculated so far gives us an expected total return of 6.2% a year.
Adding current yield does not factor in dividend growth. Coca-Cola is one of only 32 Dividend Kings; stocks with over 50 consecutive years of dividend increases. The company’s dividend will very likely continue to grow.
As mentioned earlier, I expect dividend payments (not on a per share basis) to grow in line with earnings, at 5% a year. In total, I expect Coca-Cola to pay $8.00 in dividends over the next 5 years, as the image below shows:
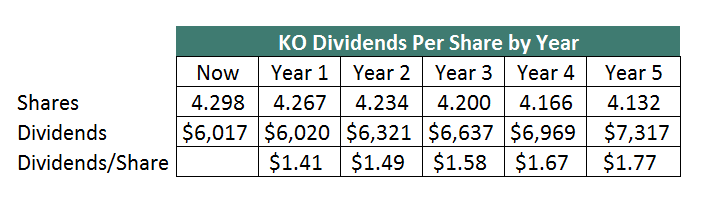
Factoring in dividend growth adds in an extra 0.2 percentage points to total return, for a total of 6.4% a year.
Putting It All Together
When you look at where total returns will actually come from you can better estimate how much you expect to make from an investment.
This allows you to more accurately compare investments to each other.
When we analyzed Coca-Cola, we came up with an estimated total return of 6.4% a year. You may think the company will grow earnings at 7% a year instead of 5%, or that its fair price-to-earnings ratio is really 30. This will increase expected total returns. It’s important to make your judgement as sober as possible when comparing total returns of businesses.
Update from 2021: With the benefit of hindsight, we can see how close my expected total return calculations were to reality. Looking back, the assumptions at the time appeared valid. From August 1st, 2016 (the start of the first month after this analysis was written) through July 31st, 2021 (for a full 5 years), Coca-Cola stock generated total returns of 9.1% on an annualized basis. This is 2.7 percentage points ahead of my estimate. Click here to download our Sure Analysis report (complete with a new expected total return estimate) from July 2021.
The ‘quick and easy’ way to find total return is to:
- Calculate return from change in price-to-earnings multiple
- Add in current dividend yield
- Add in expected business growth rate on a per share basis
This method will provide very similar estimates without nearly as much ‘number crunching’ as in the example above.
Total return is one of (if not the) most important financial metrics around. Total returns (through growth and dividends) are an important part of The Sure Dividend Investing Method.
This article would not be complete without providing some resources for current and historical data.
- Investor’s Hub for historical data
- Morningstar for historical data
- Value Line for historical data
- Finviz for current data
- Company investor relations pages for current and historical data
Alternatively, you can our estimates for expected total return and its three components (dividend yield, growth on a per share basis, and valuation ratio change) in The Sure Analysis Research Database.