

“Don't panic. The time to sell is before the crash, not after.” --John Templeton


CRACK CRUMBLE CRASH (May 17, 2021): There are all kinds of theories about why U.S. stocks reached all-time record overvaluations in 2021: the Fed, coronavirus, zero commissions, near-zero bank interest rates, and widespread popularity of trading. While these all have kernels of truth the real reason U.S. stocks are so overpriced is that investors poured more money into U.S. stocks during November 2020 through March 2021--just five months--than during the entire remainder of the bull market which had begun in March 2009:
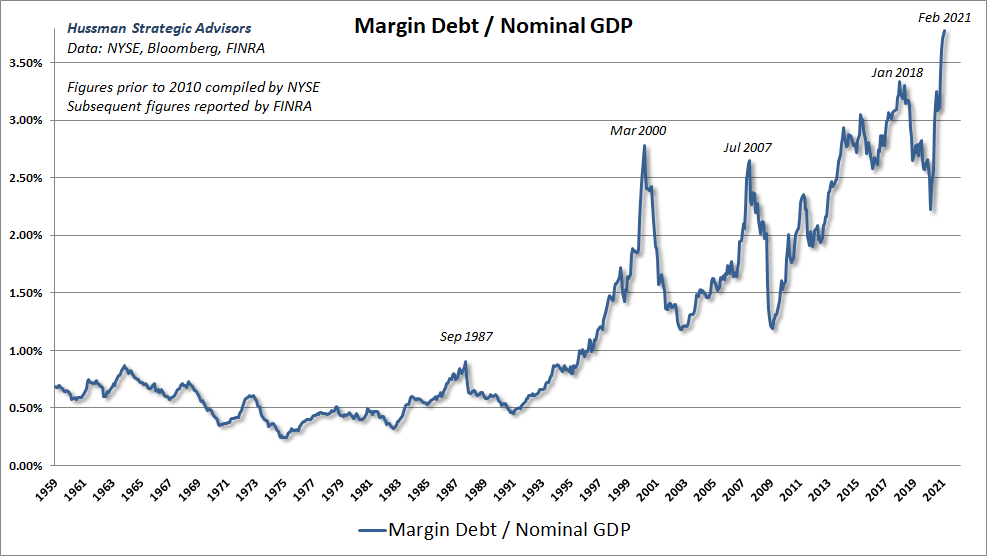
In addition to cleaning out their bank accounts and selling "boring" bonds so as to "not miss out" in the U.S. stock market, investors have borrowed all-time record amounts of money via margin loans as you can see from this chart of margin debt vs. GDP since 1959:
Downtrends have already begun for key leading sectors.
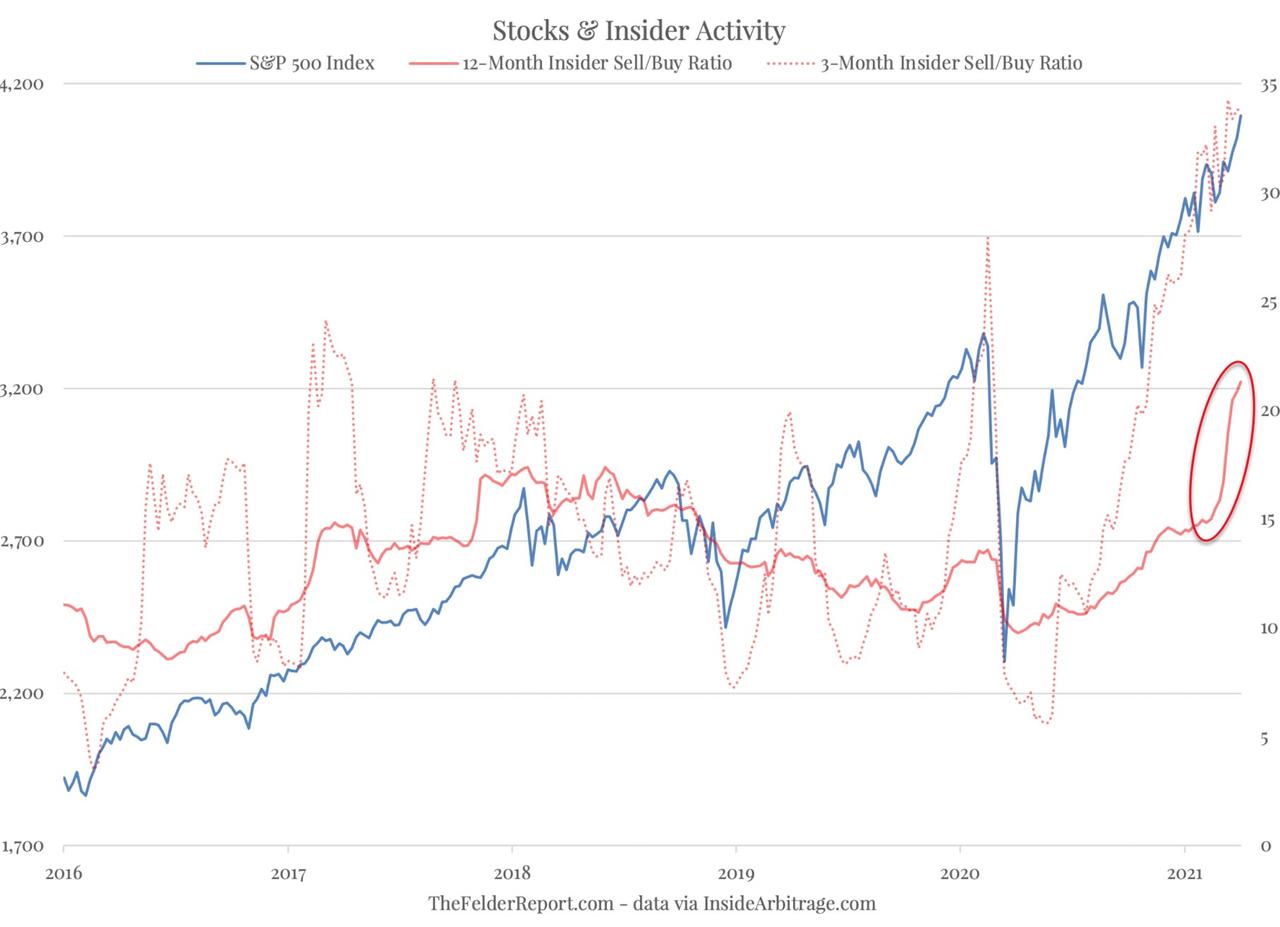
In any major bear market certain sectors tend to begin declines ahead of most other sectors. These tend to include small-caps (IWC), semiconductors (SMH), emerging market (EEM), and biotech (BBH). All of the above sectors had peaked weeks ago and have formed several lower highs since then. We also experienced the highest-ever ratios of insider selling to insider buying in U.S. dollar terms, a complete reversal from March 2020 when we had enjoyed the highest ratio of insider buying to insider selling since March 2009.
Notice the stark inversion from March 2020 to May 2021:
The following chart highlights how insider selling relative to insider buying has soared in recent months:
The media and analysts have shifted from expectations of essentially no inflation at the beginning of November 2020 to permanently-surging inflation by May 2021.
A half year ago the media, if they bothered to mention inflation at all, was about how it wouldn't be a problem for several years--if ever. In recent weeks inflation has been cited as one of the key factors in the global financial markets. It is almost certain that the media, along with most analysts and advisors, are just as wrong now as they were a half year ago but in the opposite direction. There is a long-term rising trend for inflation and interest rates worldwide which began in March 2020 but now that almost everyone is preparing themselves for higher inflation we are almost certain to move the opposite way for at least several months. Here is a useful commentary on this topic with a refreshing contrarian viewpoint on this critical topic:
The insiders and commercials are clearly pointing the way forward while almost no one is paying attention to them.
Insiders of companies which would benefit from rising inflation, such as non-precious-metals commodity producers, industrials, and the shares of major global exporters, have experienced their highest insider selling in decades. At the same time we have all-time record traders' commitments in inflation-loving currencies such as the Canadian dollar in which commercials--who are the insiders for futures trading--have never been more aggressively net short:
It's a long way to Tipperary, not to mention the bottom for nearly all asset classes.
From its dividend-adjusted zenith of 104.99 on March 10, 2000 to its 17.22 bottom on October 10, 2002, QQQ plummeted 83.6%. With even greater net inflows by average investors and all-time record selling in 2021 by top corporate insiders it is likely that the current bear market for QQQ will end up experiencing similar or greater total percentage losses within three years or less. Hardly anyone is protecting themselves against such a possibility, which might even be the most probable scenario, by hedging, selling short, or even moving to a greater cash allocation. For the first time in history more puts were sold to open--that is, to make money betting on the stock market not declining much in percentage terms--than bought to open as a form of portfolio insurance. We have also experienced all-time record levels of small speculative call buying in 2021.
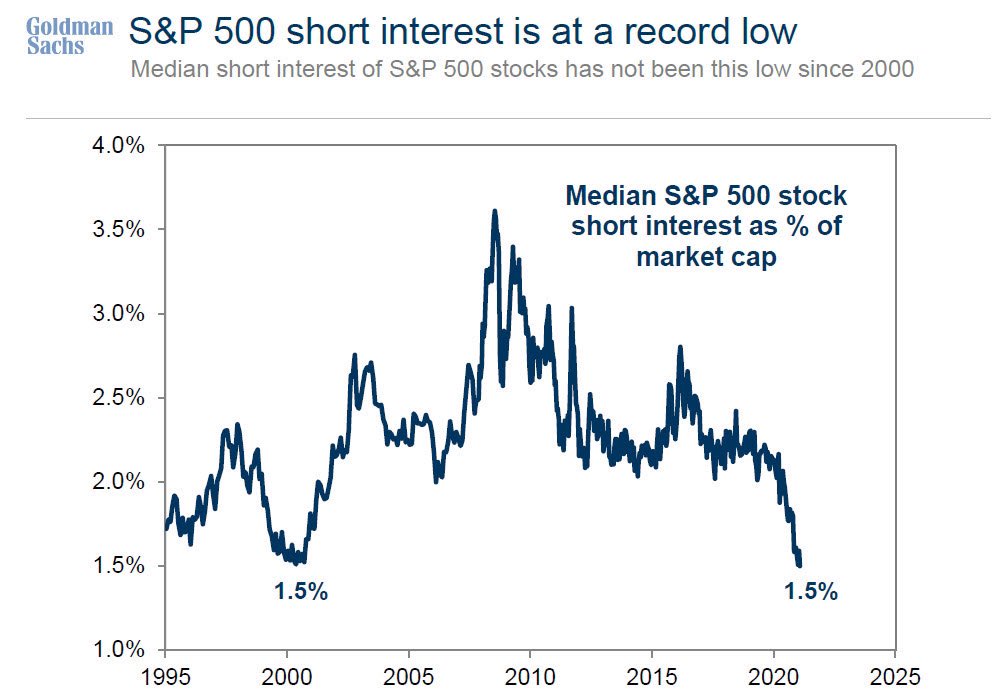
The total volume of short selling relative to market capitalization reached an all-time record low below 1.5% at the beginning of spring 2021:
The total percentage losses for unproven asset classes like cryptocurrencies and NFTs can't even be estimated, but the top-to-bottom declines for most of these will probably exceed 99%. Investors are far too easily swayed by well-known personages like Elon Musk rather than carefully considering the intrinsic merits of such speculations.
The bottom line: increasing negative divergences are pointing the way lower for U.S. equity indices in both the intermediate (3 to 6 months) and longer term (2 to 3 years) with periodic sharp upward spikes that are typical in all severe bear markets.
As the media have been maximally bullish and investors have smashed all previous net inflow records in their anticipation of higher asset valuations for U.S. stocks, corporate bonds, cryptocurrencies, real estate, collectibles, NFTs, and just about everything else, insiders and commercials and those with the most knowledge have never been more aggressive sellers. Do you think the world's wealthiest and most-experienced investors will be those who triumph over the next few years or the masses who have no idea what they are doing?There's a reason that the rich get richer and the poor remain poor. Otherwise we'd have mostly wealthy neighborhoods and a few scattered pockets of poverty rather than the other way around. It's not different this time.
Resist the temptation to become a rhinoceros, I mean a Boglehead, and remain heavily in cash.
It's time to hit an inside-the-park home run.
While you're patiently waiting for global assets to collapse you might enjoy watching a comedy I wrote in these euphoric times:
Disclosure of current holdings:
Each time QQQ has been near or above 340 I have gradually increased my short position in that fund which had plummeted 83.6% from its January 10, 2000 top to its October 10, 2002 bottom including all reinvested dividends and will likely experience a similar top-to-bottom loss by 2024 or sooner.
Here is my asset allocation with average opening prices adjusted for all dividends: 57.0% cash including TIAA Traditional Annuity paying 3% to 5% (only available for legacy retirement accounts) and Discover Bank high-yield savings paying 0.40% (available for all U.S. residents with retirement and ordinary savings accounts); 18.4% short XLK (112.7737); 16.8% long TLT (148.59); 12.3% short QQQ (296.3402); 7.4% short TSLA (494.9721); 4.5% long GEO (7.898); 1.9% short ZM (293.16); 1.4% long GDXJ (44.6462); 0.9% short AAPL (125.5481); 0.6% short IWF (223.0119); 0.5% short SMH (170.7813). It doesn't add up to 100% since short positions require less cash; there is no margin involved.
Steven Jon Kaplan runs True Contrarian where this article appeared first.
Source truecontrarian-sjk