


Updated on November 21st, 2019 by Nate Parsh
Abbott Laboratories (ABT) is a very well-known dividend growth stock, and for good reason. The company is a member of the exclusive Dividend Aristocrats, a group of elite dividend stocks with 25+ years of consecutive dividend increases.
In addition to the full downloadable spreadsheet, you can see a preview of the Dividend Aristocrats list in the table below:
| MMM | 3M Co. | 167.77 | 3.386 | 96,476 | 19.6 | 66.4 | 1.07 |
| AOS | A. O. Smith Corp. | 48.09 | 1.830 | 6,591 | 19.8 | 36.3 | 0.91 |
| ABT | Abbott Laboratories | 83.89 | 1.526 | 148,267 | 45.1 | 68.9 | 1.06 |
| ABBV | AbbVie, Inc. | 87.20 | 4.908 | 128,953 | 40.0 | 196.3 | 0.87 |
| AFL | Aflac, Inc. | 54.13 | 1.977 | 39,732 | 13.3 | 26.3 | 0.71 |
| APD | Air Products & Chemicals, Inc. | 237.90 | 1.925 | 52,422 | 29.8 | 57.4 | 0.81 |
| ADM | Archer-Daniels-Midland Co. | 42.50 | 3.259 | 23,659 | 20.1 | 65.5 | 0.81 |
| T | AT&T, Inc. | 37.18 | 5.487 | 271,599 | 16.6 | 91.0 | 0.62 |
| ADP | Automatic Data Processing, Inc. | 170.58 | 1.853 | 73,809 | 31.2 | 57.8 | 1.02 |
| BDX | Becton, Dickinson & Co. | 246.78 | 1.248 | 66,619 | 62.3 | 77.7 | 0.99 |
| BF.B | Brown-Forman Corp. | 67.00 | 0.979 | 31,995 | 39.0 | 38.2 | 0.70 |
| CAH | Cardinal Health, Inc. | 55.41 | 3.456 | 16,206 | -3.9 | -13.6 | 0.92 |
| CAT | Caterpillar, Inc. | 141.52 | 2.551 | 78,212 | 13.3 | 34.0 | 1.39 |
| CB | Chubb Ltd. | 152.51 | 1.941 | 69,117 | 19.2 | 37.2 | 0.62 |
| CVX | Chevron Corp. | 117.34 | 3.997 | 221,874 | 16.7 | 66.8 | 0.86 |
| CINF | Cincinnati Financial Corp. | 107.93 | 2.048 | 17,632 | 19.2 | 39.3 | 0.72 |
| CTAS | Cintas Corp. | 259.46 | 0.983 | 26,854 | 29.8 | 29.3 | 1.01 |
| CLX | The Clorox Co. | 146.38 | 2.760 | 18,371 | 22.9 | 63.2 | 0.44 |
| KO | The Coca-Cola Co. | 53.22 | 2.988 | 228,020 | 29.4 | 87.9 | 0.43 |
| CL | Colgate-Palmolive Co. | 67.21 | 2.529 | 57,601 | 24.9 | 62.9 | 0.54 |
| ED | Consolidated Edison, Inc. | 87.31 | 3.362 | 29,024 | 20.5 | 69.0 | 0.23 |
| DOV | Dover Corp. | 108.57 | 1.778 | 15,771 | 24.2 | 43.1 | 1.07 |
| ECL | Ecolab, Inc. | 186.22 | 0.988 | 53,676 | 35.2 | 34.8 | 0.80 |
| EMR | Emerson Electric Co. | 72.75 | 2.694 | 44,748 | 19.4 | 52.3 | 1.18 |
| XOM | Exxon Mobil Corp. | 68.03 | 4.968 | 287,842 | 19.8 | 98.5 | 0.93 |
| FRT | Federal Realty Investment Trust | 130.96 | 3.138 | 9,972 | 38.9 | 122.1 | 0.52 |
| BEN | Franklin Resources, Inc. | 27.33 | 3.805 | 13,612 | 11.6 | 44.1 | 1.10 |
| GD | General Dynamics Corp. | 184.33 | 2.165 | 53,327 | 15.8 | 34.2 | 0.90 |
| GPC | Genuine Parts Co. | 103.31 | 2.911 | 15,010 | 18.9 | 55.0 | 0.78 |
| HRL | Hormel Foods Corp. | 42.85 | 1.908 | 22,880 | 23.2 | 44.3 | 0.48 |
| ITW | Illinois Tool Works, Inc. | 172.44 | 2.360 | 55,423 | 22.6 | 53.3 | 1.20 |
| JNJ | Johnson & Johnson | 135.94 | 2.722 | 357,776 | 25.6 | 69.7 | 0.60 |
| KMB | Kimberly-Clark Corp. | 134.60 | 3.039 | 46,141 | 22.9 | 69.7 | 0.45 |
| LEG | Leggett & Platt, Inc. | 52.37 | 2.979 | 6,892 | 23.5 | 70.0 | 1.08 |
| LIN | Linde Plc | 206.18 | 1.673 | 110,754 | 21.1 | 35.3 | 0.78 |
| LOW | Lowe's Cos., Inc. | 117.83 | 1.689 | 90,941 | 36.8 | 62.1 | 1.04 |
| MKC | McCormick & Co., Inc. | 167.95 | 1.328 | 22,322 | 31.6 | 41.9 | 0.39 |
| MCD | McDonald's Corp. | 194.13 | 2.390 | 146,197 | 25.2 | 60.3 | 0.43 |
| MDT | Medtronic Plc | 111.79 | 1.825 | 149,985 | 33.9 | 61.9 | 0.67 |
| NUE | Nucor Corp. | 54.10 | 2.957 | 16,403 | 9.2 | 27.3 | 1.15 |
| PBCT | People's United Financial, Inc. | 16.32 | 4.320 | 7,248 | 12.4 | 53.6 | 0.95 |
| PNR | Pentair Plc | 43.18 | 1.656 | 7,258 | 21.0 | 34.7 | 1.20 |
| PEP | PepsiCo, Inc. | 133.74 | 2.815 | 186,491 | 15.2 | 42.7 | 0.53 |
| PPG | PPG Industries, Inc. | 126.50 | 1.542 | 29,912 | 24.8 | 38.3 | 0.90 |
| PG | Procter & Gamble Co. | 122.29 | 2.393 | 304,968 | 76.0 | 181.8 | 0.53 |
| ROP | Roper Technologies, Inc. | 353.08 | 0.524 | 36,740 | 31.7 | 16.6 | 1.04 |
| SPGI | S&P Global, Inc. | 268.10 | 0.824 | 65,523 | 31.6 | 26.0 | 1.00 |
| SHW | The Sherwin-Williams Co. | 576.02 | 0.738 | 53,171 | 38.0 | 28.0 | 0.86 |
| SWK | Stanley Black & Decker, Inc. | 153.67 | 1.737 | 23,359 | 33.0 | 57.3 | 1.52 |
| SYY | Sysco Corp. | 79.82 | 1.954 | 40,726 | 24.2 | 47.2 | 0.51 |
| TROW | T. Rowe Price Group, Inc. | 120.93 | 2.464 | 28,258 | 15.1 | 37.3 | 1.22 |
| TGT | Target Corp. | 126.43 | 2.041 | 64,596 | 20.8 | 42.3 | 0.86 |
| UTX | United Technologies Corp. | 146.65 | 2.005 | 126,573 | 24.5 | 49.2 | 1.08 |
| VFC | VF Corp. | 85.50 | 2.292 | 34,146 | 26.3 | 60.3 | 1.14 |
| GWW | W.W. Grainger, Inc. | 312.35 | 1.793 | 16,825 | 18.1 | 32.5 | 1.08 |
| WMT | Walmart, Inc. | 119.13 | 1.771 | 338,839 | 23.7 | 41.9 | 0.61 |
| WBA | Walgreens Boots Alliance, Inc. | 61.34 | 2.898 | 54,748 | 14.2 | 41.2 | 1.02 |
| Ticker | Name | Price | Dividend Yield | Market Cap ($M) | P/E Ratio | Payout Ratio | Beta |
Abbott is diversified across multiple areas of health care, each of which has positive growth potential for the long-term. This has fueled Abbott’s impressive history, and will continue to do so in the years ahead. This article will discuss the investment prospects of Abbott Laboratories in detail.
Business Overview
Abbott Laboratories is a diversified healthcare corporation with a market capitalization of $148 billion. The company was founded in 1888 and is headquartered in Lake Bluff, Illinois.
The company operates in four main segments:
- Nutritional Products
- Branded Generic Pharmaceuticals
- Diagnostics
- Medical Devices
The company’s Nutrition Products segment is characterized by market leadership. It is the #1 pediatric nutrition provider in the United States and some other geographies. Moreover, the segment’s performance has improved considerably in recent years as operating margin has improved in each and every year since 2011.
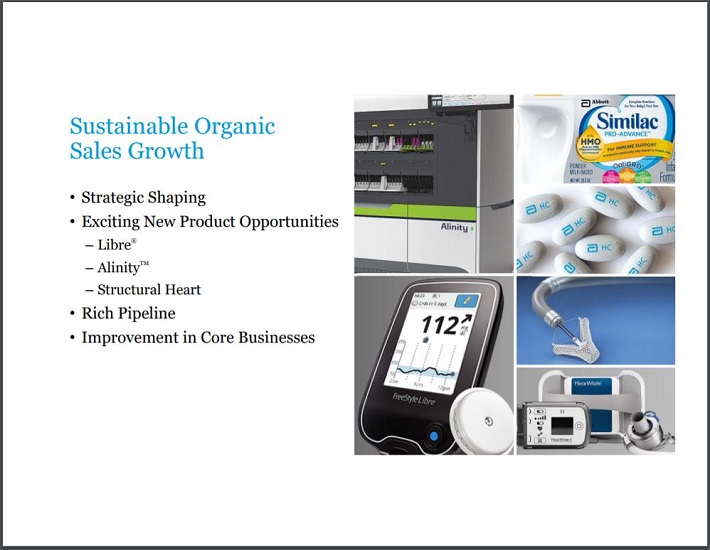
Source: Investor Presentation, slide 3
The company’s Branded Generic Pharmaceuticals segment is focused on emerging markets, with an emphasis on BRIC countries (Brazil, Russia, India, and China).
The company’s Diagnostics segment is geographically more diverse than the Branded Generic Pharmaceuticals segment. About 30% of the segment’s revenue is generated in the United States while 30% is generated in non-US developed markets and 40% is generated in emerging markets.
Similar to the Nutrition segment, the Diagnostics segment has seen significant operating margin improvements over the last several years.
Abbott Laboratories’ last segment is the Medical Devices unit. This segment was significantly bolstered in recent times by the St. Jude Medical acquisition, which helped the segment to grow sales by nearly 9% in the most recent quarter. The company’s high-quality product portfolio and the acquisition of St. Jude should fuel strong growth for the next several years.
Growth Prospects
Over time, Abbott Laboratories has shown the capability to reliably grow its adjusted earnings-per-share. Abbott Laboratories spun-off AbbVie (ABBV) in 2013, and both businesses have performed well since the spin-off. If an investor had held onto their shares of both companies, their per-share earnings would total $10.79 in 2018. This is up significantly from the $4.99 (growth of 13.7% per year) of adjusted earnings-per-share reported by the combined company in 2012.
Looking ahead, Abbott Laboratories has two major growth prospects that will help its business to become increasingly more profitable over the years to come.
The first is the aging population, both domestically and within the United States. In 2018, the percent of the global population that exceeded age 65 was 8.9%. This proportion is expected to reach 16.7% in 2050.

Source: Investor Presentation, slide 5.
The second broad tailwind that will benefit Abbott Laboratories is the company’s focus on the emerging markets. This is particularly true for its Branded Generic Pharmaceuticals segment.
Many of the countries that this segment is focused on spending a very small proportion of their overall GDP on healthcare, a rate that is expected to increase in the future.
The aging domestic population combined with the rather low focus on healthcare spending in emerging market countries should leave Abbott Laboratories plenty of room to grow for the foreseeable future.
Competitive Advantages & Recession Performance
Abbott Laboratories’ competitive advantage is two-fold. The first component is its remarkable brand recognition among its consumer medical products, particularly in its Nutrition segment. Led by noteworthy products like the Ensure meal replacement supplement, Abbott Laboratories brands allows its sales to stand strong through even the worst economic recessions.
The second component of Abbott’s competitive advantage is its focus on research and development. The company’s R&D expense over the last several years is shown below:
- 2014 research & development expense: $1.3 billion
- 2015 research & development expense: $1.4 billion
- 2016 research & development expense: $1.4 billion
- 2017 research & development expense: $2.2 billion
- 2018 research & development expense: $2.3 billion
- 2019 research & development expense: $1.8 billion (through first three quarters of the year)
Abbott Laboratories’ investment in research & development show that the company is willing to play the long game, building out its product pipeline and improving its long-term business growth prospects.
Abbott also has a competitive advantage that comes from its laser-sharp focus on shareholder value. In many ways, this starts at the top of the business via the leadership of Miles D. White. Mr. White, a Stanford-educated mechanical engineer and businessman by training, is retiring after 21 years as Abbott’s Chief Executive Officer. Robert Ford, Abbott’s President and COO, will become CEO on March 31st, 2020 and Mr. White will remain Executive Chairman. Mr. Ford has been with Abbott for 23 years.
As a large, diversified healthcare business, Abbott Laboratories is extraordinarily recession-resistant. The company actually managed to increase its adjusted earnings-per-share during each year of the 2007-2009 financial crisis.
- 2007 earnings-per-share of $2.84
- 2008 earnings-per-share of $3.03 (6.7% increase)
- 2009 earnings-per-share of $3.72 (22.8% increase)
- 2010 earnings-per-share of $4.17 (12.1% increase)
Remarkably, Abbott Laboratories managed to grow its earnings-per-share during the global financial crisis – one of the most economically difficult time periods on record. At the same time, the company’s share count increased. This means that Abbott Laboratories didn’t use share repurchases to grow earnings-per-share, they were simply more profitable during a tumultuous time. We expect this recession-resistant Dividend Aristocrat to perform similarly well during future downturns in the business environment.
From a dividend perspective, Abbott Laboratories’ dividend also appears very safe.
Valuation & Expected Total Returns
When Abbott Laboratories reported third-quarter earnings on October 16th, the company narrowed its full-year adjusted earnings-per-share guidance to $3.23 to $3.25 from $3.21 to $3.27. This performance forecast gives investors a benchmark by which to assess the company’s current valuation.
Abbott Laboratories is currently trading at $84 per share. Using this price combined with the midpoint of the company’s guidance for adjusted earnings-per-share of $3.24 gives the stock a price-to-earnings ratio of 25.9.
Abbott Laboratories’ has traded with an average price-to-earnings ratio of 19.9 over the past five years. The current valuation is noticeably higher than its long-term average. Given the company’s innovative product line, ability to grow during difficult economic times and ability to add quality businesses to its core, we feel that a fair price-to-earnings ratio of 20 is appropriate. If shares revert to our fair value estimate of 20, this would reduce total returns by 5% per year.
While right now may not be the best time to purchase shares of Abbott, investors should look for any meaningful downturn in the share price as a buying opportunity, given the high-quality nature of the business model.
The other major component of Abbott Laboratories’ future total returns will be the company’s earnings-per-share growth. As we’ve seen, the company has a proven ability to grow earnings in the high-single-digits each year. We expect that this growth is likely to continue and investors can reasonably expect 6% in annual adjusted earnings-per-share growth moving forward.
Lastly, Abbott’s total returns will receive a boost from the company’s dividend payments. After increasing its dividend 14.3% last December, Abbott Laboratories now pays a quarterly dividend of $0.32 which yields 1.5% using the current share price.
Overall, Abbott Laboratories’ expected total returns will be composed of:
- 6% earnings-per-share growth
- 1.5% dividend yield
- 5% multiple reversion
Total expected annual returns are forecasted at 2.5% through 2024. This is a fairly low expected rate of return, due to the overvaluation of the stock at the present time.
Final Thoughts
Abbott Laboratories has many of the characteristics of an appealing dividend investment. It has a recession-resistant business model that allows it to continue growing earnings-per-share through various economic environments. It also has a long history of steadily increasing dividend payments.
While the company’s current valuation exceeds its long-term average, Abbott Laboratories remains a strong hold and we recommend that investors buy this high-quality stock on any notable dips.