


Updated on November 29th, 2019 by Nate Parsh
The Dividend Aristocrats are among the highest-quality dividend growth stocks an investor can buy. The Dividend Aristocrats have increased their dividends for 25+ consecutive years.
There are currently 57 Dividend Aristocrats. You can download an Excel spreadsheet of all 57 (with metrics that matter) by clicking the link below:
In addition to the downloadable spreadsheet, you can see a preview of the Dividend Aristocrats list in the table below:
| 3M Co. | 169.77 | 3.3 | 97,626 | 19.8 | 66.4 | 1.08 |
| A. O. Smith Corp. | 48.40 | 1.8 | 6,633 | 20.0 | 36.3 | 0.91 |
| Abbott Laboratories | 85.45 | 1.5 | 151,024 | 46.0 | 68.9 | 1.04 |
| AbbVie, Inc. | 87.73 | 4.9 | 129,736 | 40.2 | 196.3 | 0.88 |
| Aflac, Inc. | 54.84 | 2.0 | 40,253 | 13.5 | 26.3 | 0.72 |
| Air Products & Chemicals, Inc. | 236.33 | 1.9 | 52,076 | 29.6 | 57.4 | 0.81 |
| Archer-Daniels-Midland Co. | 42.93 | 3.2 | 23,898 | 20.3 | 65.5 | 0.83 |
| AT&T, Inc. | 37.38 | 5.5 | 273,060 | 16.7 | 91.0 | 0.60 |
| Automatic Data Processing, Inc. | 170.78 | 1.9 | 73,896 | 31.2 | 57.8 | 1.01 |
| Becton, Dickinson & Co. | 258.50 | 1.2 | 69,783 | 65.3 | 77.8 | 1.00 |
| Brown-Forman Corp. | 67.82 | 1.0 | 32,386 | 39.5 | 38.2 | 0.72 |
| Cardinal Health, Inc. | 55.03 | 3.5 | 16,095 | -3.9 | -13.6 | 0.94 |
| Caterpillar, Inc. | 144.73 | 2.5 | 79,986 | 13.6 | 34.0 | 1.36 |
| Chubb Ltd. | 151.48 | 2.0 | 68,651 | 19.0 | 37.2 | 0.62 |
| Chevron Corp. | 117.13 | 4.0 | 221,477 | 16.7 | 66.8 | 0.84 |
| Cincinnati Financial Corp. | 107.05 | 2.1 | 17,489 | 19.0 | 39.3 | 0.71 |
| Cintas Corp. | 257.06 | 1.0 | 26,605 | 29.5 | 29.3 | 1.01 |
| The Clorox Co. | 148.23 | 2.7 | 18,603 | 23.2 | 63.2 | 0.46 |
| The Coca-Cola Co. | 53.40 | 3.0 | 228,791 | 29.5 | 87.9 | 0.44 |
| Colgate-Palmolive Co. | 67.82 | 2.5 | 58,124 | 25.1 | 62.9 | 0.55 |
| Consolidated Edison, Inc. | 86.89 | 3.4 | 28,884 | 20.4 | 69.0 | 0.24 |
| Dover Corp. | 111.48 | 1.7 | 16,194 | 24.9 | 43.1 | 1.11 |
| Ecolab, Inc. | 186.67 | 1.0 | 53,806 | 35.3 | 34.8 | 0.80 |
| Emerson Electric Co. | 73.86 | 2.7 | 44,992 | 19.7 | 52.3 | 1.19 |
| Exxon Mobil Corp. | 68.13 | 5.0 | 288,265 | 19.9 | 98.5 | 0.92 |
| Federal Realty Investment Trust | 132.07 | 3.1 | 10,057 | 39.2 | 122.1 | 0.53 |
| Franklin Resources, Inc. | 27.49 | 3.8 | 13,691 | 11.7 | 44.1 | 1.13 |
| General Dynamics Corp. | 181.74 | 2.2 | 52,578 | 15.6 | 34.2 | 0.91 |
| Genuine Parts Co. | 104.37 | 2.9 | 15,164 | 19.1 | 55.0 | 0.77 |
| Hormel Foods Corp. | 44.53 | 1.9 | 23,777 | 24.3 | 45.9 | 0.51 |
| Illinois Tool Works, Inc. | 174.33 | 2.3 | 56,030 | 22.9 | 53.3 | 1.21 |
| Johnson & Johnson | 137.49 | 2.7 | 361,855 | 25.9 | 69.7 | 0.60 |
| Kimberly-Clark Corp. | 136.34 | 3.0 | 46,738 | 23.2 | 69.7 | 0.48 |
| Leggett & Platt, Inc. | 52.32 | 3.0 | 6,885 | 23.5 | 70.0 | 1.09 |
| Linde Plc | 206.21 | 1.7 | 110,771 | 21.1 | 35.3 | 0.78 |
| Lowe's Cos., Inc. | 117.31 | 1.8 | 90,094 | 31.0 | 54.4 | 1.04 |
| McCormick & Co., Inc. | 169.25 | 1.3 | 22,495 | 31.8 | 41.9 | 0.40 |
| McDonald's Corp. | 194.48 | 2.4 | 146,461 | 25.3 | 60.3 | 0.42 |
| Medtronic Plc | 111.39 | 1.9 | 149,304 | 32.0 | 59.7 | 0.67 |
| Nucor Corp. | 56.36 | 2.8 | 17,089 | 9.6 | 27.3 | 1.17 |
| People's United Financial, Inc. | 16.50 | 4.3 | 7,328 | 12.5 | 53.6 | 0.95 |
| Pentair Plc | 44.35 | 1.6 | 7,454 | 21.5 | 34.7 | 1.21 |
| PepsiCo, Inc. | 135.83 | 2.8 | 189,405 | 15.4 | 42.7 | 0.52 |
| PPG Industries, Inc. | 128.84 | 1.5 | 30,465 | 25.3 | 38.3 | 0.92 |
| Procter & Gamble Co. | 122.06 | 2.4 | 304,394 | 75.8 | 181.8 | 0.54 |
| Roper Technologies, Inc. | 360.37 | 0.5 | 37,499 | 32.4 | 16.6 | 1.04 |
| S&P Global, Inc. | 264.65 | 0.8 | 64,680 | 31.2 | 26.0 | 0.98 |
| The Sherwin-Williams Co. | 583.13 | 0.7 | 53,828 | 38.5 | 28.0 | 0.88 |
| Stanley Black & Decker, Inc. | 157.74 | 1.7 | 23,978 | 33.9 | 57.3 | 1.55 |
| Sysco Corp. | 80.55 | 1.9 | 41,098 | 24.4 | 47.2 | 0.51 |
| T. Rowe Price Group, Inc. | 123.56 | 2.4 | 28,873 | 15.5 | 37.3 | 1.22 |
| Target Corp. | 125.01 | 2.1 | 63,339 | 19.8 | 41.2 | 0.85 |
| United Technologies Corp. | 148.34 | 2.0 | 128,031 | 24.8 | 49.2 | 1.13 |
| VF Corp. | 88.54 | 2.2 | 35,360 | 27.2 | 60.3 | 1.15 |
| W.W. Grainger, Inc. | 316.95 | 1.8 | 17,072 | 18.4 | 32.5 | 1.06 |
| Walmart, Inc. | 119.09 | 1.8 | 338,725 | 23.7 | 41.9 | 0.61 |
| Walgreens Boots Alliance, Inc. | 59.60 | 3.0 | 53,195 | 13.8 | 41.2 | 1.04 |
| Name | Price | Dividend Yield | Market Cap ($M) | Forward P/E Ratio | Payout Ratio | Beta |
An even smaller group of stocks have raised their dividends for 50+ years in a row. These are known as the Dividend Kings. Genuine Parts (GPC) has increased its dividend for 63 years straight, giving the company one of the longest dividend growth streaks in the market. You can see all 27 Dividend Kings here.
There is nothing overly exciting about Genuine Parts’ business model, but its steady annual dividend increases proves that boring can be just what income investors need for long-term dividend growth.
Business Overview
Genuine Parts traces its roots back to 1928, when Carlyle Fraser purchased Motor Parts Depot for $40,000. He renamed it, Genuine Parts Company. The original Genuine Parts store had annual sales of just $75,000, and only 6 employees.
Today, Genuine Parts has the world’s largest global auto parts network, with over 6,700 NAPA stores in North America and over 2,000 stores in Europe. Genuine Parts generated nearly $20 billion of revenue in 2019 and has a current market capitalization of $15.2 billion.
Genuine Parts is a distributor of automotive replacement parts, industrial replacement parts, office products, and electrical materials.
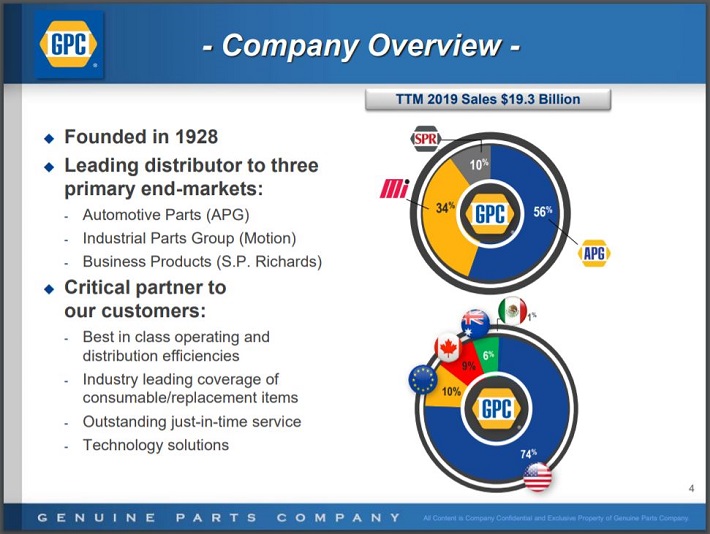
Source: Investor Presentation, slide 4.
It operates four segments, led by automotive parts, which houses the NAPA brand.
The industrial parts group sells industrial replacement parts to MRO (maintenance, repair, and operations) and OEM (original equipment manufacturer) customers. Customers are derived from a wide range of segments, including food and beverage, metals and mining, oil and gas, and health care.
The office products segment distributes business products in the U.S. and Canada. Customers include office products dealers, office supply stores, college bookstores, office furniture dealers, and more. Genuine Parts also distributes electrical and electronic materials to original equipment manufacturers and industrial assembly firms.
Genuine Parts reported third-quarter earnings on 10/17/19 and showed another quarter of growth. Revenue increased 6.2% to $5 billion, driven once again by acquisitions, though results were slightly below estimates. Comparable sales, which measures sales at retail stores open at least one year, rose 1.2% from the same quarter a year ago. Currency translation was a 1% headwind to results.
The core Automotive business grew 5.3%, mostly due to acquisitions. The sale of the company’s Grupo Auto Todo sale reduced results by 1.2%. Revenues for the Industrial business was higher by almost 10%. Adjusted earnings-per-share increased 1.4% to $1.50, which was $0.03 above estimates.
The company did lower its forecast for adjusted earnings-per-share for 2019 to a range of $5.60 to $5.68 from $5.65 to $5.75 previously, mostly due to a sale of its Electrical Specialties Group business. Still, Genuine Parts expects 2019 to be another highly profitable year, and will likely continue to generate long-term growth due to a very favorable industry trend.
Growth Prospects
Genuine Parts is primed for success, as the environment for auto replacement parts is highly positive. Consumers are holding onto their cars longer and are increasingly making minor repairs to keep cars on the road for longer, rather than buying new cars. As average costs of vehicle repair increase as a car ages, this directly benefits Genuine Parts.
According to Genuine Parts, vehicles aged six years or older now represent over 70% of cars on the road. This bodes very well for Genuine Parts.
In addition, the market for automotive aftermarket products and services is significant.
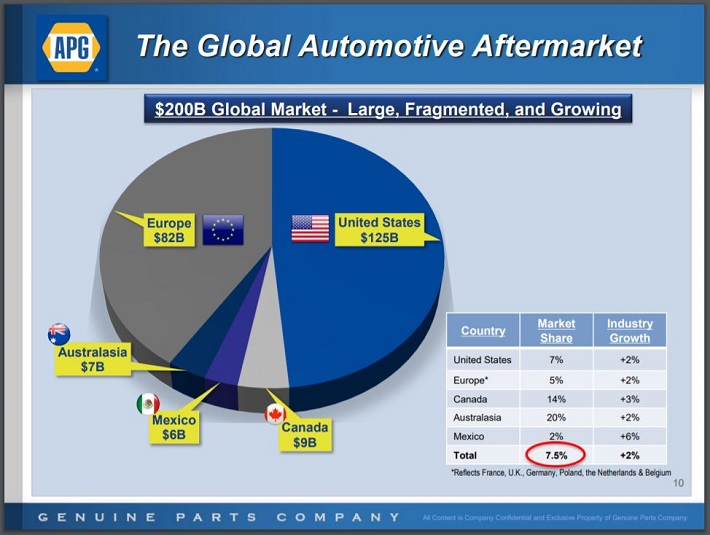
Source: Investor Presentation, slide 10.
Genuine Parts has a sizable portion of the $200 billion and growing automotive aftermarket business.
One way Genuine Parts has captured market share in this space has historically been acquisitions. It frequently acquires smaller companies, in the U.S. and in the international markets, to boost market share in existing categories or expand in new areas. Genuine Parts has made several acquisitions over the course of its history.
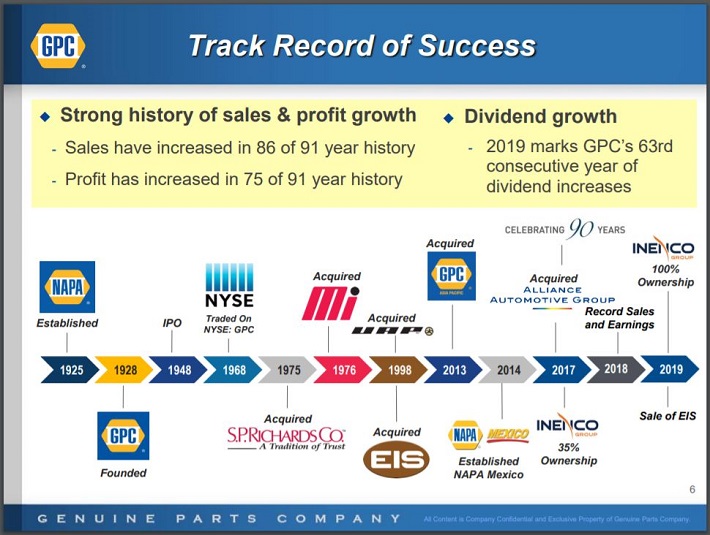
Source: Investor Presentation, slide 6.
For example, Genuine Parts acquired of Alliance Automotive Group for $2 billion. Alliance is a European distributor of vehicle parts, tools, and workshop equipment. This was an attractive acquisition, as Alliance Automotive holds a top 3 market share position in Europe’s largest automotive aftermarkets: the U.K., France, and Germany. The deal added $1.7 billion of annual revenue to Genuine Parts, along with additional earnings growth potential from cost synergies.
In 2018, Genuine Parts agreed to acquire Hennig Fahrzeugteile, a Germany-based supplier of light and commercial vehicle parts. The acquisition expanded Genuine Parts’ reach in Europe, and also gave it further exposure to the commercial market. Genuine Parts expects the acquired company will boost its annual sales by $190 million.
More recently, Genuine Parts has made several acquisitions that should add to the company’s leadership position in several different markets.
On 6/1/2019, Genuine Parts completed its acquisition of PartsPoint. Based on the Netherlands, PartsPoint is a leading distributor of automotive aftermarkets parts and accessories. The company completed its purchase of leading industrial distributor Inenco at the beginning of July. Inenco has operations in Australia, New Zealand and Indonesia. Later that month, Genuine Parts announced it was adding Todd Group, a leader in the heavy-duty aftermarket segment in France.
These three deals completed over the past few months have added a combined total of $815 million to Genuine Parts’ annual sales. The results of Genuine Parts’ growth strategy speak for themselves. The company has generated record sales in 7 of the last 10 years, along with record EPS in 8 of the last 10 years.

Source: Investor Presentation, slide 7.
Acquisitions will continue to fuel growth in the years ahead.
The company has consistently generated growth over the long term. Future earnings growth is still attainable, through organic growth, acquisitions, and share repurchases.
Competitive Advantages & Recession Performance
The biggest challenge facing the retail industry right now, is the threat of e-commerce competition. But automotive parts retailers such as NAPA are not exposed to this risk.
Automotive repairs are often complex, challenging tasks. NAPA is a leading brand, thanks in part to its reputation for quality products and service. It is valuable for customers to be able to ask questions to qualified staff, which gives Genuine Parts a competitive advantage.
Genuine Parts has a leadership position across its businesses. All four of its operating segments represent the #1 or #2 brand in its respective category. This leads to a strong brand, and steady demand from customers.
Genuine Parts’ earnings-per-share during the Great Recession are below:
- 2007 earnings-per-share of $2.98
- 2008 earnings-per-share of $2.92 (2.0% decline)
- 2009 earnings-per-share of $2.50 (14% decline)
- 2010 earnings-per-share of $3.00 (20% increase)
Earnings-per-share declined significantly in 2009, which should come as no surprise. Consumers tend to tighten their belts when the economy enters a downturn.
That said, Genuine Parts remained highly profitable throughout the recession, and returned to growth in 2010 and beyond. In fact, the company has experienced just one year of earnings decline (2016) since this period of time. There will always be a certain level of demand for automotive parts, which gives Genuine Parts’ earnings a high floor.
Valuation & Expected Returns
Based on the most recent closing price of $104 and the midpoint expected 2019 earnings-per-share, Genuine Parts has a price-to-earnings ratio of 18.4. Our fair value estimate for Genuine Parts is a price-to-earnings ratio of 16.0. As a result, Genuine Parts is overvalued at the present time.
A declining valuation multiple would negatively impact future returns to the tune of 2.8% per year over the next five years. Fortunately, Genuine Parts’ future earnings growth and dividends will more than offset a slightly overvalued share price.
We expect Genuine Parts to grow its earnings-per-share by 6% annually over the next five years. The stock has a 2.9% current yield, which is significantly higher than the average yield of the S&P 500 Index. And, Genuine Parts raises its dividend each year, including a 5.9% increase in 2019.
Genuine Parts has a highly sustainable dividend. The company has paid a dividend every year since it went public in 1948. The dividend is likely to continue growing for many years to come. That said, investors should also consider the impact of valuation when it comes to a stock’s total returns.
Genuine Parts’ total annual returns would consist of the following:
- 6% earnings growth
- 2.8% multiple reversion
- 2.9% dividend yield
In total, Genuine Parts is expected to offer a total annual return of 6.1% through 2024. This is a satisfactory, if unspectacular, rate of return.
Final Thoughts
Genuine Parts does not get much coverage in the financial media. It is far from the high-flying tech startups that typically receive more attention. However, Genuine Parts is a very appealing stock for investors looking for stable profitability and reliable dividend growth.
The company has a long runway of growth ahead, due to favorable industry dynamics. It should continue to raise its dividend each year, as it has for the past 63 years.
Today, however, is likely not the best time to buy shares of Genuine Parts, as the stock appears to be slightly overvalued. Given its history of dividend growth, Genuine Parts is suitable for investors needing income today. Investors looking for more growth will likely consider the stock a hold due to mid-single digit returns.