


Published on October 17th, 2019 by Josh Arnold
Coca-Cola (KO) is one of the most storied dividend payers in the entire stock market. The company has paid a quarterly dividend continuously since 1920, and for the past 57 years, it has paid increasing dividends each year.
That makes Coca-Cola a member of the exclusive list of the Dividend Aristocrats, a group of 57 stocks in the S&P 500 Index with 25+ consecutive annual dividend increases. Coca Cola stock also has a current yield of 3%, which is significantly higher than the ~2% current yield of the broader S&P 500 Index.
Because of its long history of steady dividend increases, we view Coca Cola as a blue chip stock.
You can download the complete list of all 271 blue chip stocks below:
Click here to download your Excel spreadsheet of all 271 blue chip stocks, including metrics that matter like dividend yield and the price-to-earnings ratio.
You can view a preview of our blue chip stocks spreadsheet below:
| MMM | 3M Co. | 162.18 | 3.5 | 93,298.7 | 19.2 | 66.3 |
| AOS | A. O. Smith Corp. | 48.81 | 1.7 | 6,752.9 | 19.5 | 33.5 |
| ABT | Abbott Laboratories | 81.78 | 1.5 | 144,538.0 | 49.9 | 75.6 |
| ABBV | AbbVie, Inc. | 74.75 | 5.6 | 110,516.4 | 27.4 | 153.0 |
| AFL | Aflac, Inc. | 52.66 | 2.0 | 38,988.6 | 12.8 | 25.7 |
| APD | Air Products & Chemicals, Inc. | 214.21 | 2.1 | 47,202.2 | 27.6 | 58.2 |
| ADM | Archer-Daniels-Midland Co. | 39.70 | 3.5 | 22,111.9 | 17.0 | 58.5 |
| T | AT&T, Inc. | 37.79 | 5.4 | 276,131.5 | 15.8 | 85.1 |
| ADP | Automatic Data Processing, Inc. | 164.16 | 1.9 | 71,196.0 | 31.1 | 58.0 |
| BDX | Becton, Dickinson & Co. | 252.94 | 1.2 | 68,282.2 | 86.9 | 105.2 |
| BF.B | Brown-Forman Corp. | 63.50 | 1.0 | 30,323.7 | 37.0 | 38.2 |
| CAH | Cardinal Health, Inc. | 49.07 | 3.9 | 14,348.3 | 10.8 | 42.2 |
| CAT | Caterpillar, Inc. | 130.19 | 2.6 | 73,243.5 | 12.0 | 31.7 |
| CB | Chubb Ltd. | 154.65 | 1.9 | 70,481.6 | 18.8 | 35.8 |
| CVX | Chevron Corp. | 115.11 | 4.0 | 218,527.1 | 14.8 | 59.4 |
| CINF | Cincinnati Financial Corp. | 115.25 | 1.9 | 18,824.5 | 15.4 | 29.1 |
| CTAS | Cintas Corp. | 266.97 | 0.0 | 27,631.4 | 30.6 | 0.0 |
| CLX | The Clorox Co. | 148.51 | 2.7 | 18,637.1 | 23.1 | 61.3 |
| KO | The Coca-Cola Co. | 53.49 | 3.0 | 228,724.8 | 32.5 | 96.1 |
| CL | Colgate-Palmolive Co. | 67.85 | 2.5 | 58,215.7 | 25.8 | 64.2 |
| ED | Consolidated Edison, Inc. | 90.84 | 3.2 | 30,172.0 | 21.5 | 68.8 |
| DOV | Dover Corp. | 95.82 | 2.0 | 13,935.9 | 23.2 | 46.5 |
| ECL | Ecolab, Inc. | 195.23 | 0.9 | 56,177.8 | 37.6 | 34.5 |
| EMR | Emerson Electric Co. | 67.32 | 2.9 | 41,408.6 | 18.9 | 55.0 |
| XOM | Exxon Mobil Corp. | 68.23 | 4.9 | 288,688.6 | 16.4 | 80.2 |
| FRT | Federal Realty Investment Trust | 137.19 | 3.0 | 10,369.0 | 41.6 | 123.6 |
| BEN | Franklin Resources, Inc. | 26.89 | 3.8 | 13,543.6 | 9.9 | 37.3 |
| GD | General Dynamics Corp. | 178.29 | 2.2 | 51,498.0 | 15.7 | 34.3 |
| GPC | Genuine Parts Co. | 97.73 | 3.0 | 14,276.2 | 18.1 | 54.8 |
| HRL | Hormel Foods Corp. | 40.56 | 2.0 | 21,657.8 | 22.0 | 44.3 |
| ITW | Illinois Tool Works, Inc. | 155.76 | 2.6 | 50,384.9 | 20.8 | 53.4 |
| JNJ | Johnson & Johnson | 135.17 | 2.7 | 356,736.6 | ||
| KMB | Kimberly-Clark Corp. | 134.70 | 3.0 | 46,363.7 | 25.8 | 77.8 |
| LEG | Leggett & Platt, Inc. | 42.56 | 3.6 | 5,595.4 | 19.7 | 71.2 |
| LIN | Linde Plc | 196.85 | 1.7 | 106,415.3 | 19.6 | 33.9 |
| LOW | Lowe's Cos., Inc. | 112.33 | 1.8 | 86,696.2 | 35.1 | 62.1 |
| MKC | McCormick & Co., Inc. | 160.43 | 1.4 | 21,323.1 | 30.2 | 41.9 |
| MCD | McDonald's Corp. | 208.30 | 2.2 | 158,192.2 | 27.1 | 58.4 |
| MDT | Medtronic Plc | 108.50 | 1.9 | 145,571.2 | 32.9 | 61.9 |
| NUE | Nucor Corp. | 51.52 | 3.1 | 15,618.6 | 7.3 | 22.3 |
| PBCT | People's United Financial, Inc. | 15.77 | 4.5 | 6,288.3 | 12.0 | 53.6 |
| PNR | Pentair Plc | 37.82 | 1.9 | 6,355.6 | 17.7 | 33.2 |
| PEP | PepsiCo, Inc. | 136.42 | 2.8 | 190,228.1 | 15.5 | 42.7 |
| PPG | PPG Industries, Inc. | 118.96 | 1.6 | 28,109.4 | 23.3 | 37.6 |
| PG | Procter & Gamble Co. | 117.53 | 2.5 | 294,134.1 | 80.5 | 198.5 |
| ROP | Roper Technologies, Inc. | 335.68 | 0.5 | 34,911.4 | 30.9 | 16.6 |
| SPGI | S&P Global, Inc. | 252.30 | 0.8 | 62,141.5 | 31.8 | 27.0 |
| SHW | The Sherwin-Williams Co. | 564.24 | 0.7 | 52,054.5 | 44.5 | 31.4 |
| SWK | Stanley Black & Decker, Inc. | 147.39 | 1.8 | 22,365.4 | 30.9 | 55.3 |
| SYY | Sysco Corp. | 78.91 | 1.9 | 40,402.5 | 24.3 | 47.1 |
| TROW | T. Rowe Price Group, Inc. | 111.06 | 2.6 | 26,161.8 | 13.8 | 36.2 |
| TGT | Target Corp. | 112.19 | 2.3 | 57,321.1 | 18.4 | 42.3 |
| UTX | United Technologies Corp. | 136.71 | 2.1 | 117,969.7 | 22.1 | 46.9 |
| VFC | VF Corp. | 91.36 | 2.2 | 36,377.5 | 31.5 | 68.6 |
| GWW | W.W. Grainger, Inc. | 307.86 | 1.8 | 16,800.3 | 20.9 | 37.4 |
| WMT | Walmart, Inc. | 119.42 | 1.8 | 339,663.9 | 26.8 | 47.1 |
| WBA | Walgreens Boots Alliance, Inc. | 54.66 | 3.2 | 49,365.8 | 10.7 | 34.4 |
| ABM | ABM Industries, Inc. | 36.79 | 1.9 | 2,443.4 | 27.4 | 53.3 |
| AWR | American States Water Co. | 93.09 | 1.2 | 3,428.7 | 45.0 | 53.2 |
| CBSH | Commerce Bancshares, Inc. (Missouri) | 61.50 | 1.6 | 6,749.4 | 16.4 | 25.8 |
| CWT | California Water Service Group | 54.64 | 1.4 | 2,630.4 | 44.4 | 62.6 |
| FMCB | Farmers & Merchants Bancorp (California) | 761.60 | 1.8 | 599.4 | 11.4 | 21.0 |
| LANC | Lancaster Colony Corp. | 139.03 | 1.8 | 3,822.4 | 25.4 | 46.6 |
| NDSN | Nordson Corp. | 144.60 | 1.0 | 8,313.1 | 25.9 | 25.1 |
| NWN | Northwest Natural Holding Co. | 69.67 | 2.7 | 2,121.0 | 29.5 | 80.3 |
| PH | Parker-Hannifin Corp. | 180.25 | 1.8 | 23,161.9 | 15.5 | 27.1 |
| SCL | Stepan Co. | 93.93 | 1.0 | 2,118.8 | 20.7 | 21.5 |
| SJW | SJW Group | 72.34 | 1.6 | 2,057.5 | 39.4 | 63.2 |
| TR | Tootsie Roll Industries, Inc. | 34.29 | 1.0 | 2,247.2 | 38.5 | 39.5 |
| MO | Altria Group, Inc. | 43.51 | 7.4 | 81,281.0 | 12.9 | 95.0 |
| VZ | Verizon Communications, Inc. | 60.29 | 4.0 | 249,359.4 | 15.7 | 62.9 |
| CMCSA | Comcast Corp. | 45.60 | 1.8 | 207,251.3 | 17.2 | 30.1 |
| TDS | Telephone & Data Systems, Inc. | 25.13 | 2.6 | 2,877.7 | 18.5 | 47.8 |
| JW/A | 0.00 | 0.0 | 0.0 | |||
| MDP | Meredith Corp. | 35.48 | 6.3 | 1,604.8 | -50.3 | -317.7 |
| NKE | NIKE, Inc. | 94.88 | 0.9 | 148,110.5 | 34.6 | 32.1 |
| TJX | The TJX Cos., Inc. | 59.29 | 1.4 | 71,899.2 | 23.6 | 33.8 |
| ROST | Ross Stores, Inc. | 112.25 | 0.9 | 40,604.2 | 25.3 | 21.6 |
| BBY | Best Buy Co., Inc. | 68.41 | 2.8 | 18,031.0 | 12.2 | 33.8 |
| HAS | Hasbro, Inc. | 121.99 | 2.1 | 15,395.3 | 49.5 | 106.4 |
| TIF | Tiffany & Co. | 91.40 | 2.4 | 11,041.0 | 19.8 | 48.3 |
| COLM | Columbia Sportswear Co. | 99.34 | 0.9 | 6,711.1 | 22.0 | 20.8 |
| PII | Polaris Industries Inc. | 89.79 | 2.7 | 5,488.2 | 17.1 | 46.0 |
| WSM | Williams-Sonoma, Inc. | 69.85 | 2.6 | 5,449.8 | 15.8 | 41.1 |
| AAN | Aaron's, Inc. | 71.25 | 0.2 | 4,812.7 | 23.7 | 4.5 |
| CBRL | Cracker Barrel Old Country Store, Inc. | 156.07 | 3.2 | 3,753.5 | 16.8 | 54.3 |
| MNRO | Monro, Inc. | 78.86 | 1.0 | 2,620.0 | 32.1 | 33.3 |
| ISCA | International Speedway Corp. | 45.00 | 1.0 | 1,956.8 | 25.5 | 26.6 |
| PM | Philip Morris International, Inc. | 79.10 | 5.8 | 123,066.9 | 15.7 | 90.7 |
| COST | Costco Wholesale Corp. | 298.78 | 0.8 | 131,360.7 | 35.9 | 29.3 |
| GIS | General Mills, Inc. | 52.65 | 3.7 | 31,821.3 | 16.9 | 62.9 |
| K | Kellogg Co. | 61.33 | 3.7 | 20,891.0 | 24.3 | 88.9 |
| CHD | Church & Dwight Co., Inc. | 72.99 | 1.2 | 18,035.5 | 29.7 | 36.3 |
| KR | The Kroger Co. | 24.51 | 2.4 | 19,647.7 | 12.0 | 28.3 |
| BF/B | 140779 | 0.00 | 0.0 | 0.0 | ||
| SJM | The J. M. Smucker Co. | 107.55 | 3.2 | 12,265.9 | 22.8 | 72.8 |
| BG | Bunge Ltd. | 55.40 | 3.6 | 7,842.3 | 14.7 | 53.0 |
| CASY | Casey's General Stores, Inc. | 161.54 | 0.7 | 5,941.9 | 27.1 | 19.9 |
| FLO | Flowers Foods, Inc. | 21.70 | 3.4 | 4,589.9 | 25.6 | 86.0 |
| JJSF | J&J Snack Foods Corp. | 193.27 | 1.0 | 3,641.4 | 39.4 | 39.7 |
| NUS | Nu Skin Enterprises, Inc. | 42.53 | 3.5 | 2,362.4 | 18.9 | 65.5 |
| VGR | Vector Group Ltd. | 11.48 | 13.0 | 1,696.6 | 21.5 | 278.2 |
| UVV | Universal Corp. | 52.93 | 5.7 | 1,321.7 | 14.3 | 81.4 |
| ANDE | The Andersons, Inc. | 18.31 | 3.7 | 596.9 | 14.7 | 54.1 |
| EPD | Enterprise Products Partners LP | 27.50 | 6.3 | 60,197.8 | 11.9 | 75.1 |
| ET | Energy Transfer LP | 12.55 | 9.7 | 32,968.3 | 10.0 | 97.3 |
| OXY | Occidental Petroleum Corp. | 40.34 | 7.7 | 36,083.3 | 8.0 | 61.6 |
| OKE | ONEOK, Inc. | 68.45 | 5.0 | 28,267.7 | 22.5 | 111.9 |
| MMP | Magellan Midstream Partners LP | 64.68 | 6.1 | 14,773.1 | 10.8 | 65.6 |
| HP | Helmerich & Payne, Inc. | 37.69 | 7.5 | 4,124.6 | -55.2 | -415.8 |
| HEP | Holly Energy Partners LP | 21.70 | 12.3 | 2,288.0 | 12.1 | 148.2 |
| TRV | The Travelers Cos., Inc. | 142.57 | 2.2 | 37,123.2 | 14.1 | 31.0 |
| PRU | Prudential Financial, Inc. | 89.45 | 4.2 | 35,958.9 | 9.0 | 38.1 |
| AMP | Ameriprise Financial, Inc. | 139.77 | 2.6 | 18,291.7 | 10.2 | 26.7 |
| PFG | Principal Financial Group, Inc. | 55.40 | 3.9 | 15,445.3 | 10.3 | 40.1 |
| WRB | W.R. Berkley Corp. | 70.47 | 0.6 | 12,908.4 | 19.4 | 11.3 |
| FDS | FactSet Research Systems, Inc. | 248.95 | 1.1 | 9,523.8 | ||
| BRO | Brown & Brown, Inc. | 36.08 | 0.9 | 10,148.4 | 26.2 | 22.9 |
| ERIE | Erie Indemnity Co. | 181.57 | 1.9 | 8,387.0 | 27.6 | 53.9 |
| TMK | Torchmark Corp. | 88.10 | 0.8 | 9,685.8 | 13.7 | 10.3 |
| AFG | American Financial Group, Inc. | 102.23 | 1.5 | 9,194.8 | 12.8 | 19.4 |
| SEIC | SEI Investments Co. | 58.79 | 1.1 | 8,878.7 | 18.7 | 21.0 |
| RNR | RenaissanceRe Holdings Ltd. | 190.27 | 0.7 | 8,402.7 | 14.1 | 9.9 |
| IVZ | Invesco Ltd. | 15.65 | 7.7 | 14,704.6 | 10.8 | 83.1 |
| AIZ | Assurant, Inc. | 125.45 | 1.9 | 7,668.9 | 21.3 | 40.1 |
| ORI | Old Republic International Corp. | 23.62 | 3.3 | 7,161.6 | 9.5 | 31.7 |
| UNM | Unum Group | 28.13 | 3.7 | 5,868.8 | 11.3 | 41.8 |
| BOKF | BOK Financial Corp. | 77.23 | 2.6 | 5,498.3 | 11.4 | 29.6 |
| CFR | Cullen/Frost Bankers, Inc. | 89.80 | 3.0 | 5,626.5 | 12.5 | 38.0 |
| THG | The Hanover Insurance Group, Inc. | 135.51 | 1.7 | 5,360.0 | 18.4 | 31.8 |
| AXS | AXIS Capital Holdings Ltd. | 63.15 | 2.5 | 5,301.3 | 48.6 | 122.3 |
| EV | Eaton Vance Corp. | 44.55 | 3.1 | 5,054.9 | 12.5 | 39.3 |
| PB | Prosperity Bancshares, Inc. | 70.01 | 2.3 | 4,788.5 | 14.8 | 33.6 |
| RLI | RLI Corp. | 91.88 | 1.0 | 4,115.0 | 32.8 | 31.8 |
| LAZ | Lazard Ltd. | 37.42 | 4.8 | 3,999.5 | 11.2 | 53.8 |
| UBSI | United Bankshares, Inc. (West Virginia) | 38.17 | 3.6 | 3,888.5 | 15.1 | 54.0 |
| OZK | Bank OZK | 28.30 | 3.0 | 3,639.4 | 8.9 | 27.0 |
| EVR | Evercore, Inc. | 76.77 | 2.7 | 3,061.0 | 8.6 | 23.2 |
| UMBF | UMB Financial Corp. | 64.28 | 1.9 | 3,154.1 | 15.9 | 29.4 |
| CBU | Community Bank System, Inc. | 62.71 | 2.4 | 3,235.5 | 18.9 | 45.9 |
| MCY | Mercury General Corp. | 54.00 | 4.6 | 2,989.2 | 15.3 | 70.8 |
| AEL | American Equity Investment Life Holding Co. | 23.69 | 0.0 | 2,155.3 | 10.1 | 0.0 |
| BANF | BancFirst Corp. (Oklahoma) | 56.32 | 2.1 | 1,838.4 | 14.0 | 29.8 |
| WABC | Westamerica Bancorporation | 62.28 | 2.6 | 1,680.4 | 22.2 | 57.3 |
| TMP | Tompkins Financial Corp. | 80.34 | 2.5 | 1,213.0 | 15.3 | 37.7 |
| SRCE | 1st Source Corp. | 46.17 | 2.3 | 1,179.0 | 13.8 | 31.0 |
| SBSI | Southside Bancshares, Inc. | 34.49 | 3.5 | 1,164.0 | 15.7 | 55.2 |
| CTBI | Community Trust Bancorp, Inc. (Kentucky) | 42.30 | 3.4 | 752.0 | 11.5 | 39.2 |
| BMRC | Bank of Marin Bancorp | 41.20 | 1.7 | 562.1 | 16.7 | 28.9 |
| FLIC | The First of Long Island Corp. | 22.69 | 3.0 | 559.8 | 13.7 | 41.2 |
| WHG | Westwood Holdings Group, Inc. | 27.87 | 10.2 | 249.3 | 18.0 | 183.0 |
| SYK | Stryker Corp. | 215.75 | 0.9 | 80,497.4 | 22.7 | 21.4 |
| MCK | McKesson Corp. | 144.84 | 1.1 | 26,781.5 | 48.0 | 51.7 |
| ABC | AmerisourceBergen Corp. | 86.05 | 1.8 | 17,926.5 | 19.1 | 35.0 |
| WST | West Pharmaceutical Services, Inc. | 139.97 | 0.4 | 10,322.6 | 45.2 | 19.4 |
| CHE | Chemed Corp. | 415.80 | 0.3 | 6,620.4 | 33.1 | 9.6 |
| PRGO | Perrigo Co. Plc | 53.93 | 1.4 | 7,337.4 | 83.7 | 121.1 |
| ENSG | The Ensign Group, Inc. | 40.51 | 0.5 | 2,162.7 | 20.7 | 9.6 |
| ATRI | Atrion Corp. | 790.00 | 0.7 | 1,465.5 | 40.6 | 27.7 |
| NHC | National HealthCare Corp. | 80.98 | 2.5 | 1,240.5 | 16.6 | 41.5 |
| UNP | Union Pacific Corp. | 163.31 | 2.1 | 115,056.8 | 19.3 | 39.7 |
| LMT | Lockheed Martin Corp. | 382.84 | 2.2 | 108,113.3 | 18.5 | 41.6 |
| NOC | Northrop Grumman Corp. | 364.69 | 1.3 | 61,704.8 | 17.8 | 23.9 |
| CSX | CSX Corp. | 69.00 | 1.3 | 55,074.1 | 16.5 | 22.0 |
| RTN | Raytheon Co. | 200.38 | 1.8 | 55,804.6 | 18.4 | 33.3 |
| WM | Waste Management, Inc. | 114.90 | 1.7 | 48,744.3 | 27.8 | 47.3 |
| FDX | FedEx Corp. | 150.77 | 1.7 | 39,337.4 | 88.3 | 152.3 |
| RSG | Republic Services, Inc. | 85.69 | 1.8 | 27,485.2 | 26.4 | 46.2 |
| LHX | L3Harris Technologies, Inc. | 206.78 | 1.3 | 46,024.1 | 25.7 | 34.1 |
| CMI | Cummins, Inc. | 166.18 | 2.7 | 26,220.9 | 10.1 | 27.7 |
| FAST | Fastenal Co. | 35.61 | 2.4 | 20,419.8 | 26.1 | 62.3 |
| EXPD | Expeditors International of Washington, Inc. | 74.42 | 1.3 | 12,705.0 | 20.2 | 25.8 |
| CHRW | C.H. Robinson Worldwide, Inc. | 86.00 | 2.3 | 11,642.5 | 17.1 | 38.9 |
| ROL | Rollins, Inc. | 35.39 | 1.1 | 11,589.7 | 51.2 | 57.4 |
| JBHT | J.B. Hunt Transport Services, Inc. | 115.65 | 0.9 | 12,347.7 | ||
| CSL | Carlisle Cos., Inc. | 140.90 | 1.1 | 7,975.8 | 19.8 | 22.4 |
| GGG | Graco, Inc. | 45.35 | 1.4 | 7,564.6 | 22.2 | 29.9 |
| TTC | The Toro Co. | 73.14 | 1.2 | 7,796.9 | 28.4 | 33.9 |
| HEI | HEICO Corp. | 122.41 | 0.1 | 16,421.7 | 52.7 | 5.6 |
| HUBB | Hubbell, Inc. | 131.35 | 2.5 | 7,146.6 | 19.4 | 48.6 |
| RHI | Robert Half International, Inc. | 54.57 | 2.2 | 6,415.3 | 14.2 | 30.7 |
| DCI | Donaldson Co., Inc. | 51.40 | 1.6 | 6,486.4 | 24.7 | 38.4 |
| LECO | Lincoln Electric Holdings, Inc. | 85.89 | 2.1 | 5,306.2 | 17.3 | 36.3 |
| ITT | ITT, Inc. | 58.60 | 1.0 | 5,156.8 | 17.0 | 16.4 |
| MSA | MSA Safety, Inc. | 111.42 | 1.4 | 4,314.1 | 35.3 | 49.4 |
| RBC | Regal Beloit Corp. | 72.40 | 1.6 | 3,036.1 | 12.0 | 18.9 |
| MSM | MSC Industrial Direct Co., Inc. | 70.91 | 3.5 | 3,914.3 | 13.3 | 46.5 |
| R | Ryder System, Inc. | 51.00 | 4.2 | 2,720.1 | 8.5 | 35.9 |
| BRC | Brady Corp. | 54.57 | 1.6 | 2,892.1 | 21.9 | 34.1 |
| FELE | Franklin Electric Co., Inc. | 47.63 | 1.1 | 2,207.1 | 23.2 | 25.8 |
| HI | Hillenbrand, Inc. | 29.78 | 2.8 | 1,866.2 | 13.3 | 37.3 |
| HCSG | Healthcare Services Group, Inc. | 24.55 | 3.2 | 1,819.5 | 21.5 | 68.4 |
| MGRC | McGrath RentCorp | 66.48 | 2.2 | 1,612.3 | 18.5 | 39.7 |
| TNC | Tennant Co. | 68.85 | 1.3 | 1,253.5 | 33.0 | 41.8 |
| MATW | Matthews International Corp. | 35.22 | 2.2 | 1,109.0 | 17.8 | 40.0 |
| LNN | Lindsay Corp. | 88.04 | 1.4 | 949.6 | 168.6 | 237.5 |
| GRC | The Gorman-Rupp Co. | 34.41 | 1.5 | 899.2 | 23.7 | 36.5 |
| MSFT | Microsoft Corp. | 140.41 | 1.3 | 1,072,087.9 | 27.5 | 36.0 |
| V | Visa, Inc. | 177.87 | 0.5 | 309,209.2 | 34.1 | 18.4 |
| IBM | International Business Machines Corp. | 142.11 | 4.5 | 125,891.7 | 14.6 | 65.1 |
| ACN | Accenture Plc | 186.57 | 1.6 | 118,871.4 | 24.9 | 39.0 |
| TXN | Texas Instruments Incorporated | 129.50 | 2.3 | 120,903.8 | 23.2 | 52.6 |
| QCOM | QUALCOMM, Inc. | 78.23 | 3.2 | 95,101.1 | 27.4 | 87.0 |
| ADI | Analog Devices, Inc. | 110.59 | 1.8 | 40,852.6 | 27.0 | 49.9 |
| XLNX | Xilinx, Inc. | 94.63 | 1.5 | 23,904.0 | 25.5 | 39.0 |
| MCHP | Microchip Technology, Inc. | 96.08 | 1.5 | 22,871.3 | 61.2 | 92.9 |
| MXIM | Maxim Integrated Products, Inc. | 57.74 | 3.2 | 15,653.1 | 19.2 | 61.0 |
| BR | Broadridge Financial Solutions, Inc. | 125.23 | 1.5 | 14,332.9 | 30.1 | 46.6 |
| JKHY | Jack Henry & Associates, Inc. | 143.70 | 1.1 | 11,057.7 | 40.8 | 43.7 |
| BMI | Badger Meter, Inc. | 51.34 | 1.2 | 1,494.7 | 41.0 | 47.9 |
| CASS | Cass Information Systems, Inc. | 51.90 | 1.8 | 752.0 | 24.7 | 45.4 |
| IFF | International Flavors & Fragrances, Inc. | 119.16 | 0.0 | 12,723.3 | 34.5 | 0.0 |
| RPM | RPM International, Inc. | 68.31 | 2.0 | 8,858.4 | 29.3 | 60.1 |
| RGLD | Royal Gold, Inc. | 118.15 | 0.9 | 7,749.7 | 82.4 | 72.8 |
| WLK | Westlake Chemical Corp. | 62.21 | 1.6 | 7,979.6 | 13.0 | 20.9 |
| ALB | Albemarle Corp. | 67.58 | 2.1 | 7,162.5 | 13.1 | 27.3 |
| ATR | AptarGroup, Inc. | 115.47 | 1.2 | 7,394.8 | 33.6 | 40.1 |
| SON | Sonoco Products Co. | 58.27 | 2.8 | 5,831.5 | 19.2 | 54.7 |
| SLGN | Silgan Holdings, Inc. | 29.98 | 1.4 | 3,333.1 | 16.5 | 23.2 |
| BCPC | Balchem Corp. | 100.49 | 0.0 | 3,251.6 | 41.4 | 0.0 |
| SXT | Sensient Technologies Corp. | 66.14 | 2.1 | 2,799.0 | 19.0 | 40.5 |
| FUL | H.B. Fuller Co. | 47.79 | 1.3 | 2,436.4 | 17.4 | 22.9 |
| KWR | Quaker Chemical Corp. | 160.51 | 0.9 | 2,835.7 | 37.6 | 35.0 |
| HWKN | Hawkins, Inc. | 40.55 | 2.3 | 432.5 | 17.2 | 38.8 |
| DLR | Digital Realty Trust, Inc. | 130.60 | 3.2 | 27,209.6 | 119.7 | 383.0 |
| O | Realty Income Corp. | 78.60 | 3.4 | 25,012.7 | 60.0 | 204.4 |
| ESS | Essex Property Trust, Inc. | 329.31 | 2.3 | 21,644.9 | 53.0 | 122.5 |
| WPC | W.P. Carey, Inc. | 90.16 | 4.6 | 15,398.2 | 31.8 | 145.4 |
| ELS | Equity LifeStyle Properties, Inc. | 67.53 | 1.7 | 12,295.1 | 45.5 | 78.4 |
| NNN | National Retail Properties, Inc. | 57.06 | 3.5 | 9,793.6 | 40.0 | 140.3 |
| OHI | Omega Healthcare Investors, Inc. | 43.29 | 6.1 | 9,449.8 | 33.9 | 206.8 |
| NHI | National Health Investors, Inc. | 82.72 | 5.0 | 3,586.8 | 22.9 | 113.7 |
| SKT | Tanger Factory Outlet Centers, Inc. | 15.66 | 9.0 | 1,464.9 | 20.2 | 181.1 |
| UHT | Universal Health Realty Income Trust | 104.00 | 2.6 | 1,430.7 | 82.7 | 214.7 |
| UBA | Urstadt Biddle Properties, Inc. | 23.63 | 4.6 | 941.8 | 37.6 | 174.4 |
| NEE | NextEra Energy, Inc. | 229.91 | 2.1 | 112,368.7 | 32.8 | 67.3 |
| DUK | Duke Energy Corp. | 95.13 | 3.9 | 69,311.8 | 21.0 | 81.9 |
| SO | The Southern Co. | 61.09 | 4.0 | 63,853.1 | 14.3 | 56.5 |
| D | Dominion Energy, Inc. | 81.80 | 4.3 | 67,232.6 | 54.9 | 235.2 |
| XEL | Xcel Energy, Inc. | 63.49 | 2.5 | 32,698.0 | 25.9 | 64.1 |
| WEC | WEC Energy Group, Inc. | 92.76 | 2.5 | 29,259.8 | 26.7 | 65.9 |
| ES | Eversource Energy | 84.58 | 2.5 | 27,370.3 | 31.2 | 76.7 |
| EIX | Edison International | 69.84 | 3.5 | 25,009.0 | -91.7 | -320.8 |
| AWK | American Water Works Co., Inc. | 121.63 | 1.6 | 21,972.8 | 37.9 | 59.4 |
| PPL | PPL Corp. | 32.41 | 5.1 | 23,408.0 | 13.1 | 66.7 |
| CMS | CMS Energy Corp. | 63.54 | 2.3 | 18,031.8 | 30.8 | 71.8 |
| EVRG | Evergy, Inc. | 63.58 | 3.0 | 14,971.0 | 27.0 | 79.9 |
| CNP | CenterPoint Energy, Inc. | 28.62 | 3.9 | 14,373.5 | 25.1 | 98.9 |
| ATO | Atmos Energy Corp. | 111.11 | 1.9 | 13,133.3 | 26.2 | 48.6 |
| BIP | Brookfield Infrastructure Partners LP | 48.06 | 4.0 | 19,580.4 | -2,529.5 | -10,236.8 |
| LNT | Alliant Energy Corp. | 52.29 | 2.6 | 12,420.0 | 24.2 | 63.8 |
| WTR | Aqua America, Inc. | 45.42 | 1.9 | 9,800.6 | 59.4 | 114.6 |
| OGE | OGE Energy Corp. | 42.31 | 3.5 | 8,469.4 | 20.8 | 71.7 |
| UGI | UGI Corp. | 47.88 | 2.3 | 8,347.3 | 25.2 | 56.7 |
| MDU | MDU Resources Group, Inc. | 27.57 | 2.9 | 5,488.1 | 18.8 | 54.8 |
| POR | Portland General Electric Co. | 56.23 | 2.6 | 5,025.4 | 25.1 | 65.8 |
| SWX | Southwest Gas Holdings, Inc. | 88.69 | 2.4 | 4,818.0 | 23.4 | 56.1 |
| BKH | Black Hills Corp. | 77.39 | 2.6 | 4,725.7 | 20.4 | 52.4 |
| NFG | National Fuel Gas Co. | 44.91 | 3.8 | 3,876.4 | 13.1 | 49.9 |
| SR | Spire, Inc. (Missouri) | 83.72 | 2.8 | 4,253.7 | 22.2 | 62.0 |
| NJR | New Jersey Resources Corp. | 43.12 | 2.7 | 3,879.9 | 28.3 | 76.8 |
| NWE | NorthWestern Corp. | 73.46 | 3.1 | 3,705.5 | 17.2 | 52.7 |
| SJI | South Jersey Industries, Inc. | 31.55 | 3.6 | 2,914.9 | 39.7 | 143.6 |
| MGEE | MGE Energy, Inc. | 76.72 | 1.8 | 2,659.7 | 31.1 | 54.8 |
| CPK | Chesapeake Utilities Corp. | 92.01 | 1.6 | 1,509.3 | 25.0 | 41.2 |
| MSEX | Middlesex Water Co. | 64.71 | 0.0 | 1,072.1 | 31.4 | 0.0 |
| CMA | Comerica, Inc. | 65.49 | 3.9 | 9,781.7 | 8.3 | 32.2 |
| TCO | Taubman Centers, Inc. | 36.83 | 7.2 | 2,254.3 | 49.8 | 359.6 |
| Ticker | Name | Price | Dividend Yield | Market Cap ($M) | P/E Ratio | Payout Ratio |
In addition, Coca-Cola is also a member of the Dividend Kings, an even smaller group of just 27 stocks that have increased their dividends for at least 50 consecutive years. Given this, Coca-Cola is owned by many investors that want a safe and growing dividend.
But for this to be the case, the company’s ability to pay the dividend – and raise it over time – must be sustainable. To that end, this article will take a closer look at Coca-Cola’s ability to grow its payout in the coming years.
Business Overview
Coca-Cola is a pure-play beverage giant on a scale that is unlike any other. The company’s very long operating history and steady growth have afforded it the ability to scale and acquire new brands over time, and today, it produces about $37 billion in revenue. It should be noted that a multi-year effort to refranchise formerly owned bottling operations has cut the top line in a bid to boost margins and reduce capex needs in recent years. Even so, Coca-Cola is one of the largest companies in the US market, trading with a market capitalization of $229 billion.
Source: Investor relations
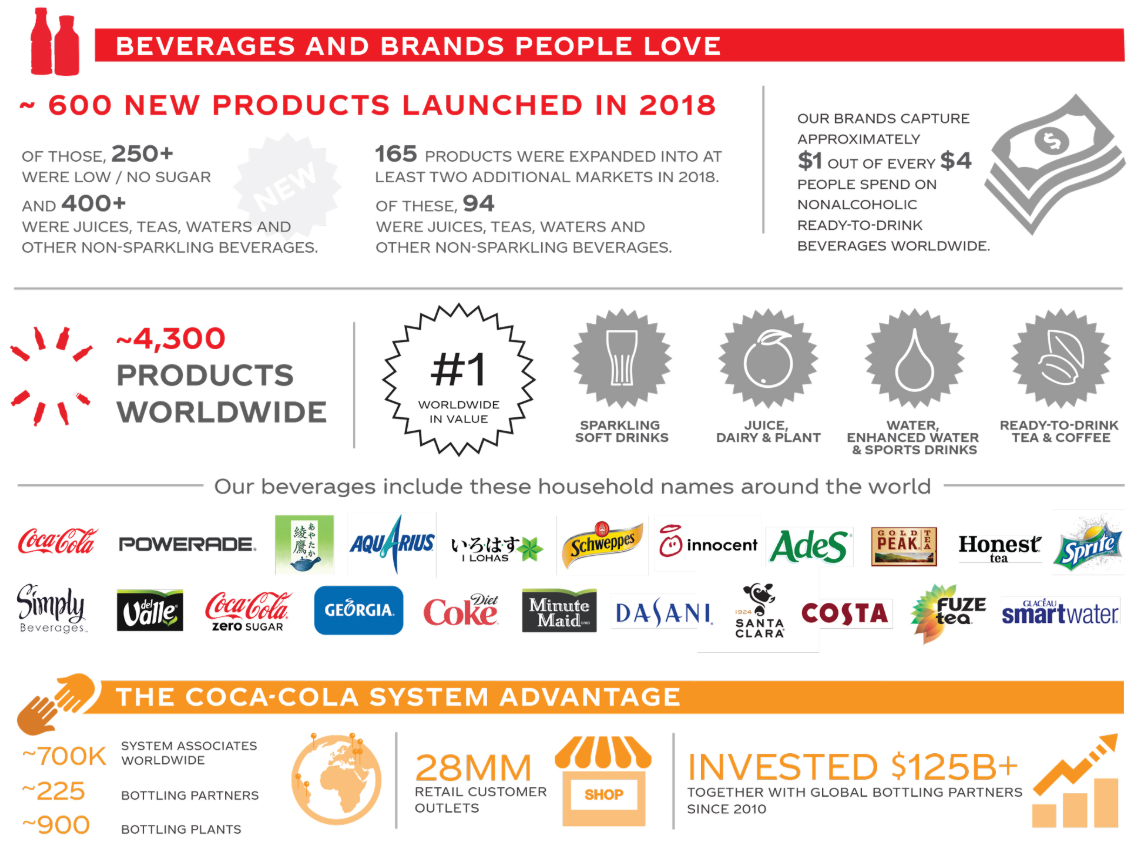
Coca-Cola’s portfolio includes an astounding 4,300 products that are sold worldwide. It has its core Coca-Cola brand, as well as popular favorites like Sprite, Diet Coke, and others. However, Coca-Cola’s growth in recent years has come from brand extensions, like flavored Coke and Diet Coke products, as well as its massive and growing portfolio of non-sparkling beverages. In addition, the company has acquired and built brands in non-sparkling categories like tea, dairy, coffee, and sports drinks to diversify away from flagging global sparkling beverage sales.
Coca-Cola has also spent tremendous amounts of money in recent years on low and no sugar drinks. In all, it launched 600 new products in 2018, and more than 250 of them were low or no sugar. In addition, of the 600 new products, more than two-thirds were non-sparkling beverages.
Source: Investor relations
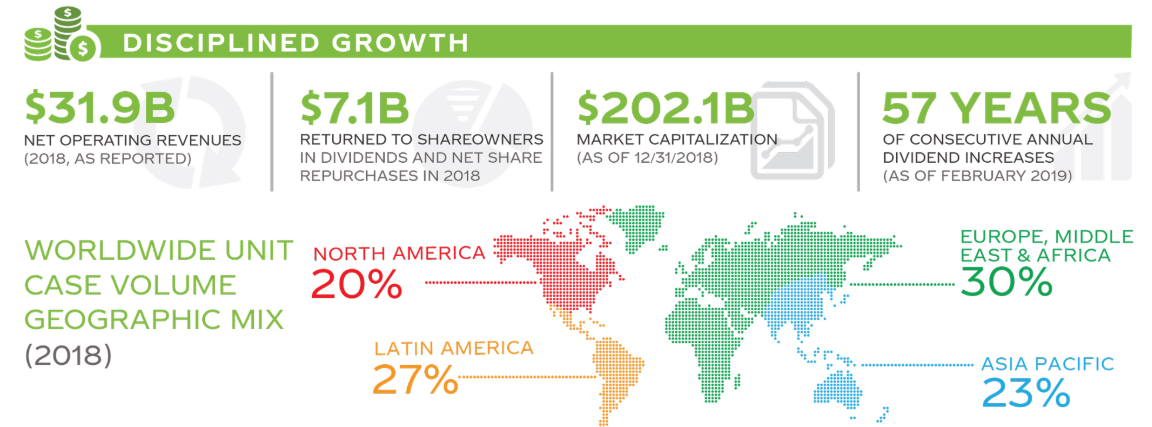
Not only has Coca-Cola built a highly diversified revenue stream in terms of product mix, but it is also very well diversified globally. Only 20% of the company’s revenue is derived from North America, with the balance of 80% coming in roughly equal parts from the rest of the world. Coca-Cola sells in nearly every country on the planet, and has strong market share just about everywhere.
And of particular interest to dividend investors, Coca-Cola returns billions of dollars to shareholders each year via cash payouts and share repurchases. This global network of revenue distribution opens Coca-Cola up to significant currency risk, but over the years, it has managed to hedge away some of that risk, and accept the rest.
Growth Prospects
Despite Coca-Cola’s massive size and scale, we believe it has a long-term runway for growth. This is the case for a variety of reasons, not the least of which is the company’s highly diversified portfolio of sparkling and non-sparkling brands, but also the large global market opportunity.
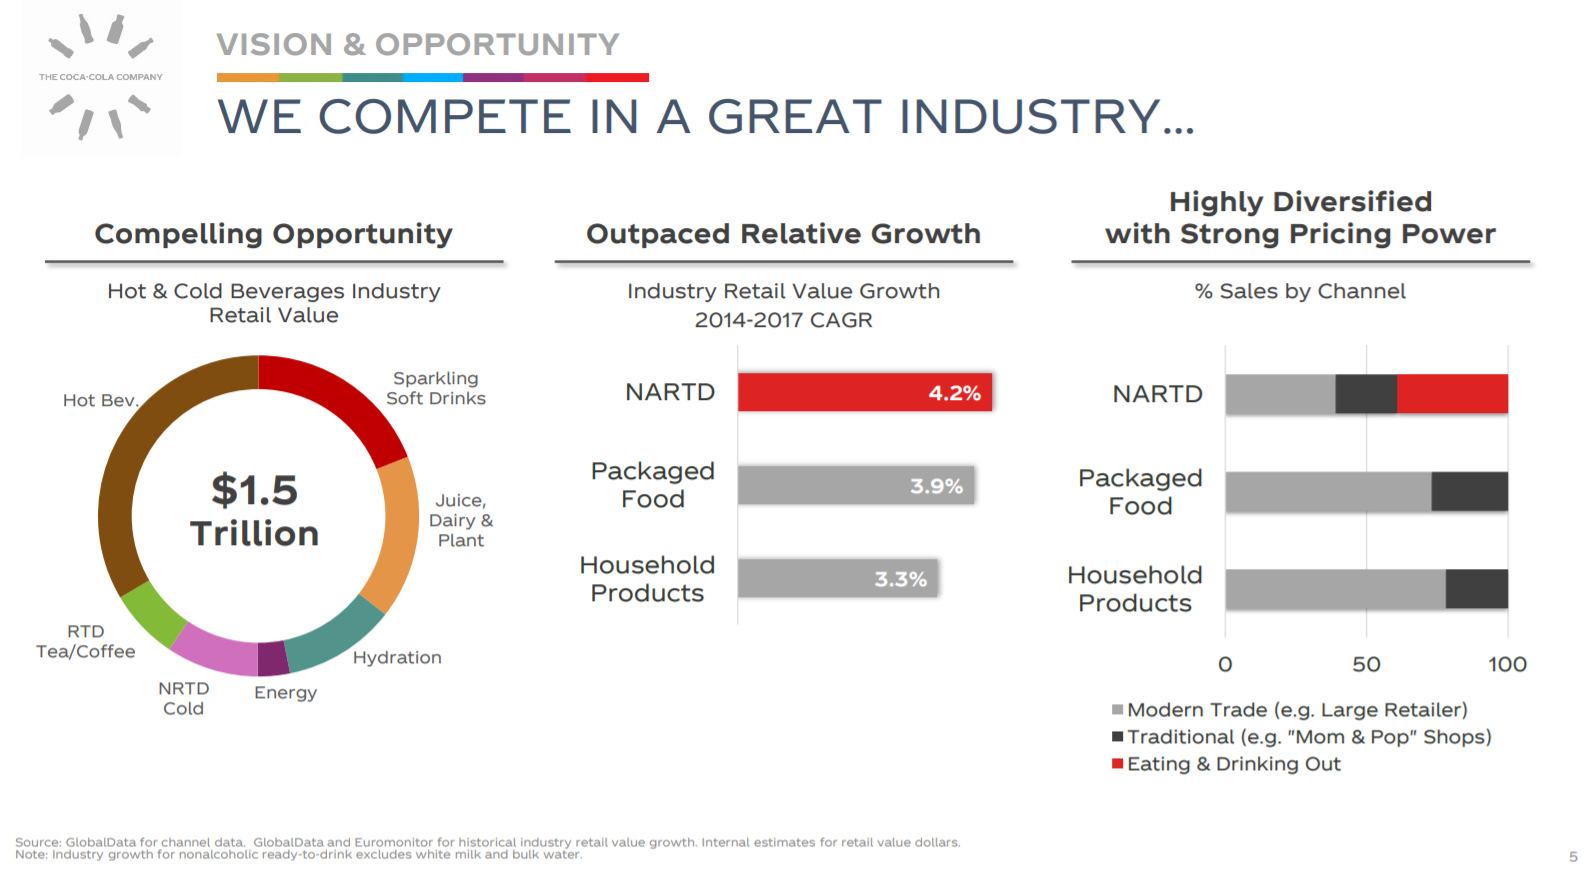
Source: Investor presentation, page 5
The company’s market share in its categories is strong, as Coca-Cola is #1 in 32 of its 40 top markets. In addition, it is #1 in more than 75 country/category combinations. That means the company has well-established brands in a variety of places around the world. However, that doesn’t mean it is done growing.
For example, ready-to-drink, or RTD, beverages are growing at a faster rate than other categories like packaged foods. In addition, unlike other categories, RTD beverages can be sold in a variety of places, including restaurants, grocery stores, general retailers, convenience stores, and more. This, combined with the massive $1.5 trillion total market value in the categories Coca-Cola competes in, mean that despite the company’s enormous size, it is nowhere near saturation.
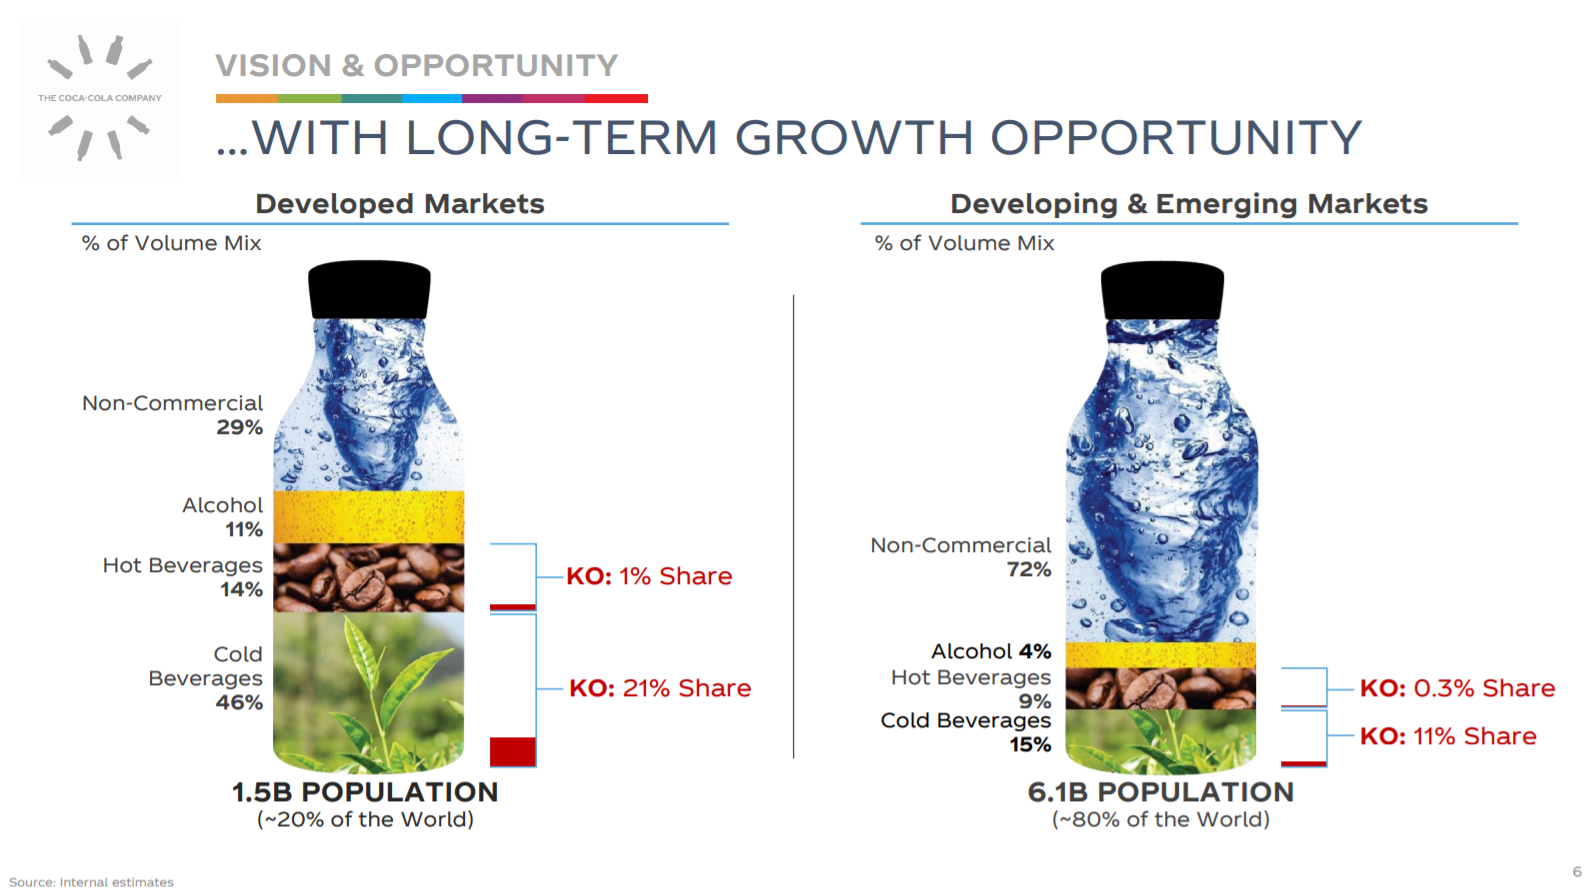
Source: Investor presentation, page 6
To that end, the company’s market share in these categories is still under development worldwide. Even in the company’s core cold beverages category, it owns less than half of worldwide developed markets. Hot beverages, which is a relatively new entry for Coca-Cola, is just 1%. In developing markets, Coca-Cola’s cold beverages market share is stronger, but it still has virtually no hot beverages market share.
We see Coca-Cola producing 6% annual earnings-per-share growth in the coming years as the company has a clear path forward to achieve it. Below is Coca-Cola’s vision for growing its portfolio in the coming years.
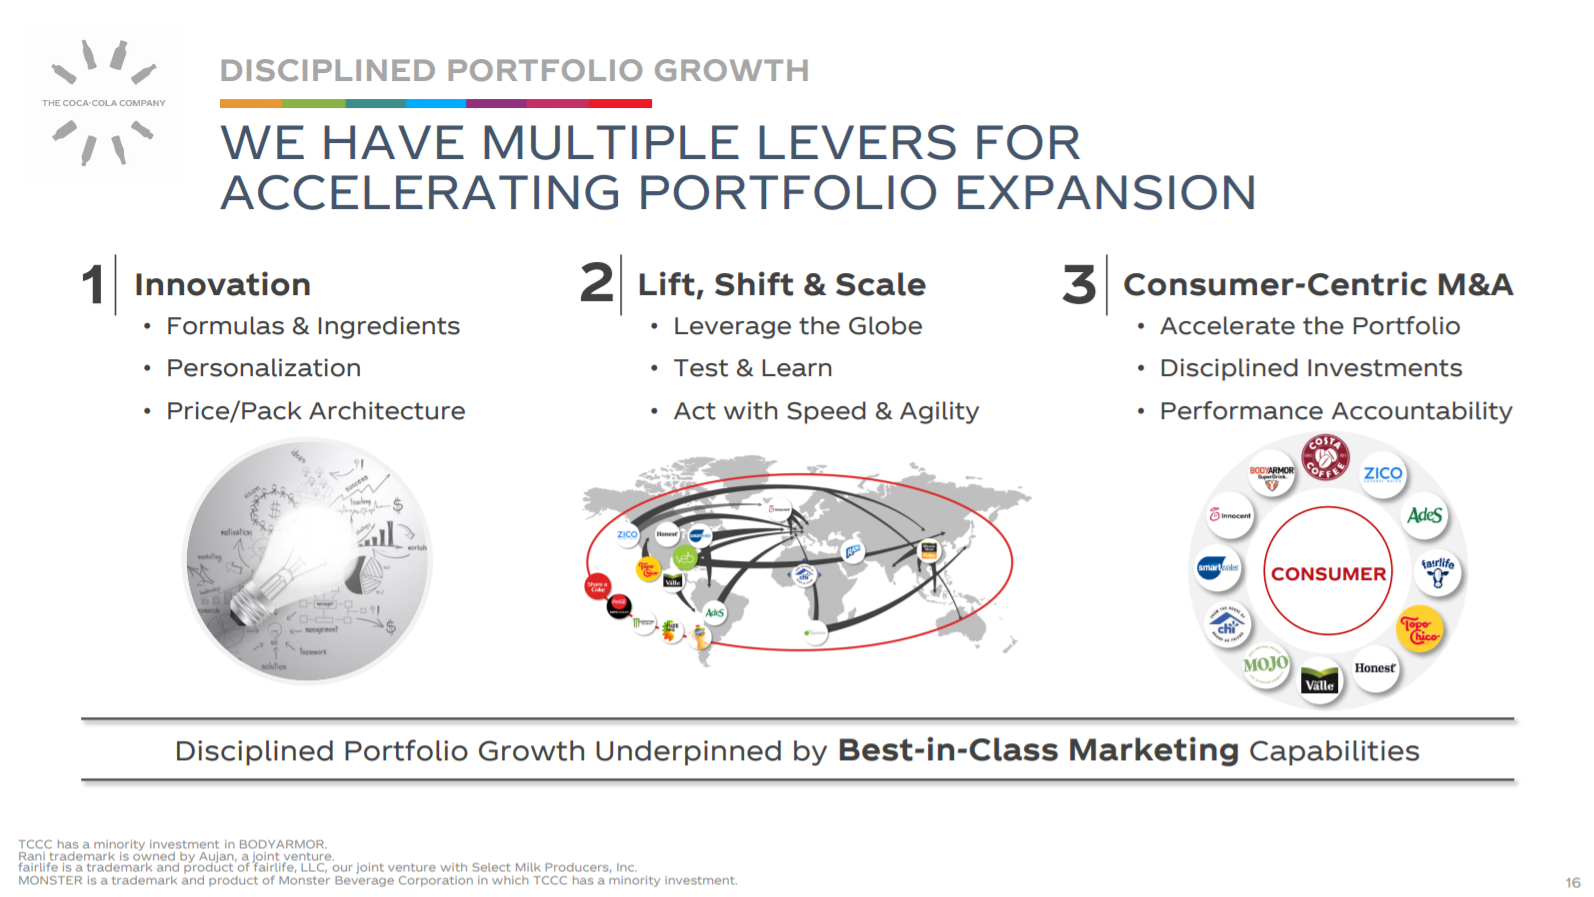
Source: Investor presentation, page 16
It includes a sizable amount of product innovation, scaling successes around the world, and buying growth where it makes sense. Coca-Cola has invested heavily in the past several years in non-sparkling beverages, but has also continued to modify its portfolio for optimum performance. This includes killing off what it deems “zombie” brands, 700 of which were terminated in 2018 alone.
This focus on only the best-performing brands allows Coca-Cola to spend its time focusing on profitable growth, not just owning the biggest possible portfolio of brands. Management believes at least 4% annual revenue growth is reasonable to expect, and we concur given the factors discussed above. We see revenue growth as a key contributor to earnings growth over time, but there is more to the growth story.
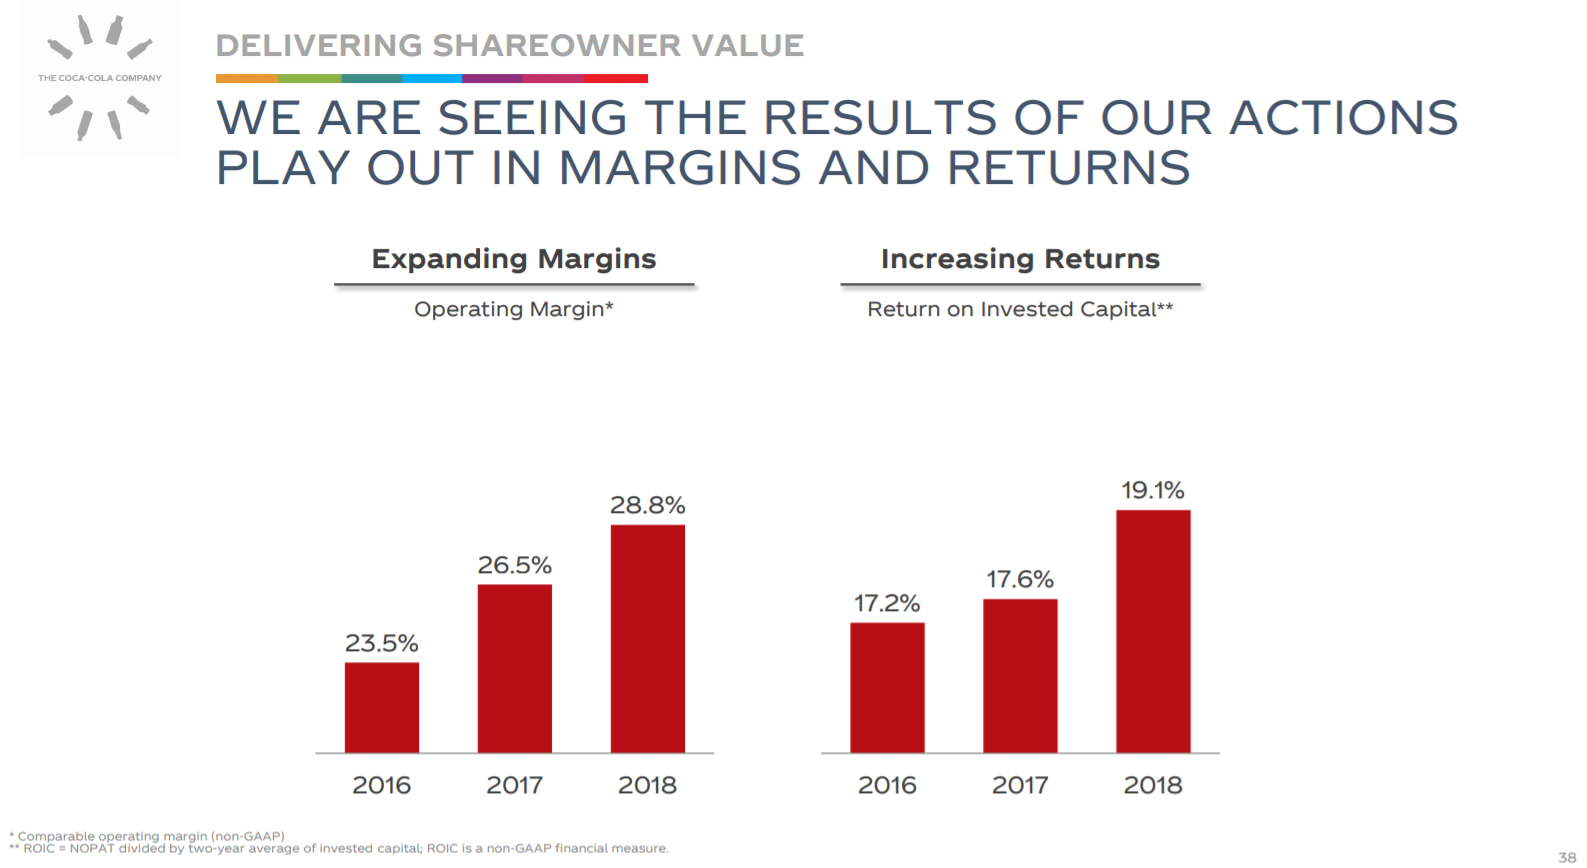
Source: Investor presentation, page 38
Coca-Cola’s transformation from a bottling and beverage company to a much purer play on just beverages has resulted in tremendous operating margin expansion in recent years. Refranchising the majority of the company’s global bottling operations, which is a low-margin, high-capex business, has seen the company’s return on capital and operating margins increase substantially.
While the bulk of these gains have been seen, Coca-Cola continues to invest in supply chain improvements and other productivity gains, as well as improved product mix. We see this as a smaller tailwind to earnings than revenue, but an important one nonetheless.
Finally, Coca-Cola buys back a lot of its own stock each year, net of new issuances for employee compensation. Coca-Cola currently produces about $6 billion in annual free cash flow, meaning it can use that money to pay dividends and buy back stock, among other things. The company issues a fair amount of new shares to employees each year, but we still see a low-single-digit tailwind to earnings-per-share from a lower share count over time. Management has committed to at least offsetting dilution from new issuances every year, but generally does a bit better than that.
Recession Performance
Part of the appeal of defensive consumer stocks like Coca-Cola is their inherent recession-resistance. Coca-Cola sells largely discretionary items, but those items are very affordable for the vast majority of people. This helps buoy sales during economic downturns when other higher-priced discretionary product sales may suffer, such as smartphones or televisions, for example. Coca-Cola’s products are affordable, meaning their recession performance is generally very strong.
Indeed, Coca-Cola actually grew its earnings-per-share by 17% in 2008 during the depths of the financial crisis, helped by a double-digit gain in revenue. The following year, revenue declined slightly and sent earnings-per-share lower by just 3%. However, 2010 saw Coca-Cola return to meaningful growth, boosting earnings-per-share by 19% on a 13% top line gain. In other words, Coca-Cola’s portfolio is built for recession resistance, and we see little reason to think the next recession will be different.
We see Coca-Cola as a highly-defensive stock and one that should continue to pay and even raise its dividend each year, into and through the next economic downturn.
Dividend Analysis
Coca-Cola’s dividend is a huge draw for investors. The company is a Dividend King and currently yields 3%, so its pedigree as an income stock is impeccable. The company’s current payout is $0.40 per share quarterly, good for $1.60 annually. That compares to our current estimate of $2.10 in earnings-per-share for this year, implying a 2019 payout ratio of 76%.
In recent years, Coca-Cola’s payout ratio has continued to increase as earnings-per-share growth stagnated, but the payout continued to grow each year. Indeed, the payout ratio was closer to 50% of earnings in the recent past, but is roughly 75% now.
This is not a major problem for Coca-Cola, because of the factors that influenced that movement higher. The new Coca-Cola is poised for continued earnings growth in a much better way than it was prior to the refranchising of the bottling operations, and the many portfolio actions discussed earlier.
In other words, while the payout ratio has increased materially in recent years, we believe that increase will be arrested by strong earnings growth that should at least somewhat outpace dividend growth going forward.
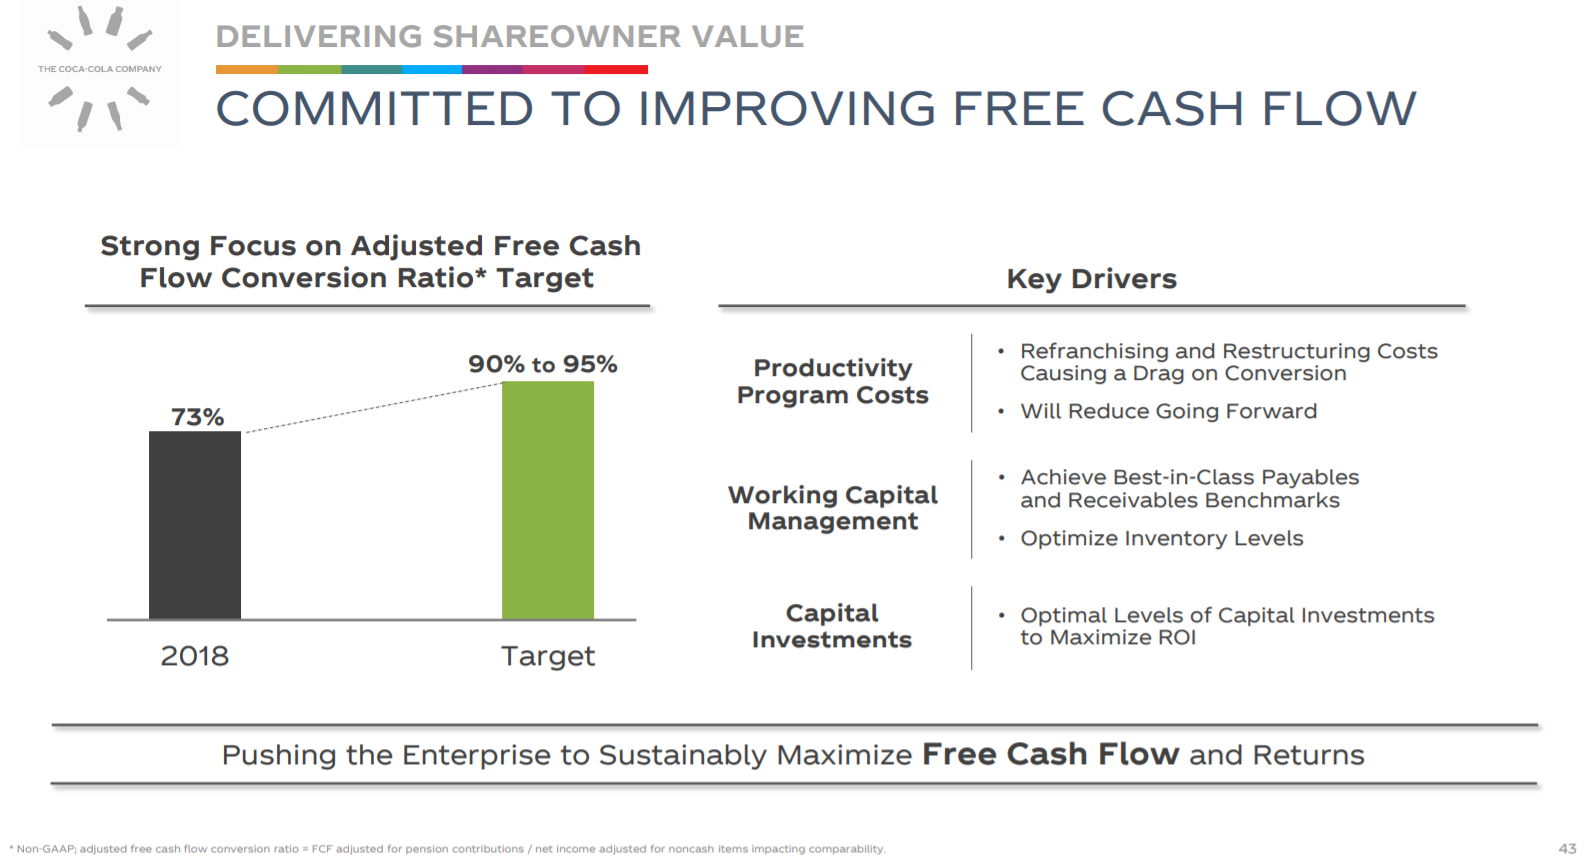
Source: Investor presentation, page 43
Coca-Cola is working to improve its free cash flow generation as well, looking to boost its conversion of earnings from the current 73%. In essence, this will create additional cash each year the company can use to pay dividends and buy back stock, and will help it continue to increase the dividend for many years to come. The virtuous cycle of higher free cash flow conversion on higher earnings should create very favorable conditions for dividend growth over the long-term.
Coca-Cola does have a significant amount of debt on its balance sheet, but given strong earnings and free cash flow generation, we don’t see the level of debt as a problem. In addition, the company has a plan to address its debt, as detailed below.

Source: Investor presentation, page 45
Coca-Cola’s long-term debt stands at ~$29 billion, and other long-term liabilities like deferred taxes come to a total of about $10 billion. Coca-Cola also uses commercial paper markets and other short-term financing heavily, but that is not counted in long-term debt as it is due in less than one year. While Coca-Cola generates a lot of cash, it uses debt financing very heavily in the normal course of operations.
Management plans to use its considerable cash generation, in part, to reduce debt over time. This is in addition to the other uses of cash above, including investing in future growth, acquisitions, paying a growing dividend, and buying back stock. Coca-Cola wants to see its net debt leverage – which is defined as total net debt divided by earnings before interest, taxes, depreciation, and amortization, also known as EBITDA – at between 2X and 2.5X.
Trailing-twelve-months EBITDA is just under $11 billion, implying target debt between ~$22 billion and ~$28 billion. Long-term liabilities stand at $39 billion, but that is offset by more than $13 billion in short-term cash and equivalents, for net long-term liabilities of about $26 billion. This level of debt is sustainable for Coca-Cola as interest expense is well covered, but significant cash generation in the years to come should see the company able to reduce its leverage over time, should it choose to do so.
You can view the video below for a further discussion of Coca-Cola’s dividend safety after release of the company’s second-quarter earnings report:
Final Thoughts
Coca-Cola is one of the very best dividend stocks in the market today. The company has an exemplary dividend growth history through a wide variety of economic conditions, and we think its growth outlook is much-improved against four or five years ago.
Coca-Cola is an attractive long-term dividend growth stock, as the ~3% current yield is more than 50% higher than the broader market, and Coca-Cola has a very long history of increased dividends. The dividend payout should continue to grow in the mid-single-digits annually. Coca-Cola’s recession performance is quite good as well, making it a defensive stock with a safe and growing dividend through all economic cycles.