


Published on January 10th 2020
This guest contribution series is by Trond K. Odegaard, MBA; CEO at VikingDividendIncome LLC.
This is the final installment of this three-part series:
- Active Portfolio Management Using Dividend Growth Stocks
- Active Portfolio Management Using Dividend Growth Stocks: The Role Of Technical Analysis
- Active Portfolio Management Using Dividend Growth Stocks: Taking Gains
Last time, we discussed how to get a good entry, the first fundamental of active investing. This installment is about taking gains, the second fundamental of active investing, and the fun part.
To set the stage, let’s say you’ve managed to obtain a good entry point, and Mr. Market has cooperated by providing you with unrealized gains. You’ve only held the stock for a couple of months. Let’s say that the gain level is about the same as your annual yield. Or, more impressively, twice the level of the yield. These are quite realistic examples.
You are confronted with a good problem to have – deciding whether to realize gains and buy something else that’s cheap… or go for a longer ride in your current stock. How do you make an intelligent, evidence-based decision – one that’s devoid of emotion?
For purposes of this discussion, I will assume we hold these stocks in an IRA, so we can trade at will with no tax consequences. I will also assume that this is an actively traded portfolio, such that the main purpose of the portfolio is to realize gains – rather than a buy-and-hold portfolio, where the main purpose is to capture dividends. This isn’t to say that you never want to take gains in a buy-and-hold portfolio, just that the hurdle is higher than is the case for an active portfolio.
Taking Gains
You could just apply a simple rule that says any position (specifically, any purchase lot) reaching, say 7% gain, is sold. This is pretty much what I did in 2019 in my personal portfolio. I picked 7% based on my sense of what was reasonable to expect from a daily MACD cycle. Following this rule got me good results: a 7.04% average return per sale, and 2.93 inventory turns on my portfolio – since April, when I started trading dividend growth stocks. That’s 20.6% realized gain. The three inventory turns involved over 250 trades, so this 20.6% was likely not a chance outcome. This doesn’t mean, of course, that it will be repeatable in 2020. No one knows what the market will do in 2020, whether it will be as generous as 2019.
In addition to the realized gains, I garnered about a 4.5% dividend return capture (6% average yield prorated over 9 months), with a negative 5.1% unrealized at year end. An even 20% total return for my efforts. The SPY ‘only’ did about a 14% total return over this time period. Had you nailed the SPY at its post-April low on June 3, you’d have gotten an 18.6% total return. But that would have been outstanding timing, or more likely, luck. I was more than satisfied. But I hadn’t done any serious research to establish this hurdle rate. So I wondered whether I had left money on the table. At year end, I thought it was a good time to do a serious study and find out.
Here’s how I did the study. I pulled each of the stocks in the VDITM stable up on Trading View, my trading system. I examined both the weekly MACD and the daily MACD cycles that occurred in 2019. I measured the return from and duration of each of the daily cycles. I tried as best I could to pick the point in the MACD cycle where I would likely have bought and likely have sold. In real time, the bottom and top of the cycles are not as obvious as they are after the fact, but I tried to replicate what my behavior would have been. So when I show, say, a return of 11.0% in the table below, it should be interpreted as 11% +/- 2%.
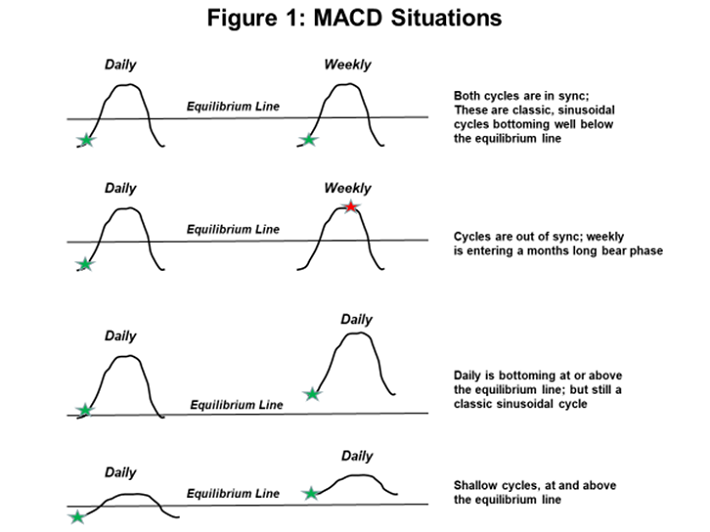
I categorized each daily cycle with the following information: whether the weekly MACD was in a bull or bear mode, whether the daily cycle was a classic deep sinusoidal shape or not, whether the daily cycle was bottoming above or below the equilibrium line, and whether I thought I would have traded on the cycle or not. I documented these specific characteristics because my modus operandi had been to trade the cycles bottoming below the equilibrium line, and avoid those bottoming above or even near the equilibrium line. I favored the classic deep cycles, and I usually avoided trading the daily cycle if the weekly was in a bear phase. So I was curious to see if these different characteristics mattered. Figure 1 below shows these different situations. Cycles are assumed to repeat, so if a cycle in the figure below has a high peak, assume the last peak was also high and therefore the bottom is a deep one.
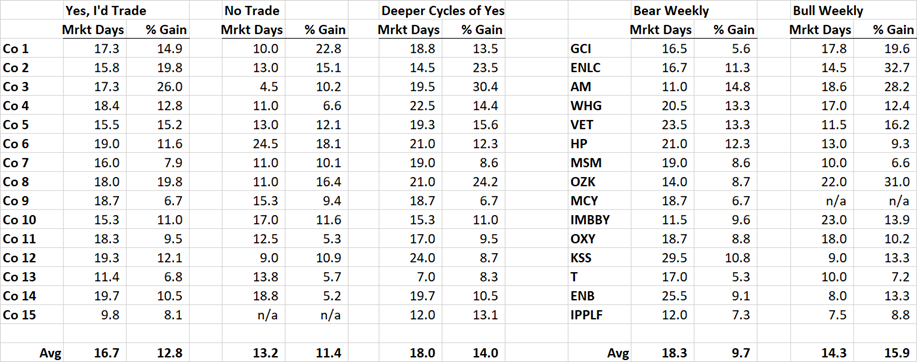
Results of the study are shown below in figure 2. They are based on a survey of a third of the VDITM stable, the third with the highest ranked combination score of expected annualized dividend return and VDITM dividend safety score. These are arguably about the best 15 stocks in the investable universe. The columns headed ‘Bear Weekly’ and ‘Bull Weekly’ are subsets of the ‘Yes, I’d Trade’ column. The ‘Deeper Cycles’ column also is a subset of the ‘Yes, I’d Trade’ column. Company identities are disguised in the chart below; VDITM subscribers have access to the study on the full stable with company identities revealed.
3 Learnings From The Study
Learning 1: It doesn’t matter much whether the daily MACD is bottoming above or below the equilibrium line, or whether the cycle is a deep classic sinusoidal shape or a shallower one. There’s a slight return advantage to the deeper cycles (which almost always bottom well below the horizontal line), and the cycles I’d have traded vs. not traded, but not enough to matter. So whether it’s a classic deep sinusoidal cycle, or a shallower one bottoming above the horizontal, if it’s a bottoming cycle it’s worthy of investment consideration. I probably left money on the table by avoiding some cycles that turned out to be good ones.
Learning 2: It’s OK to trade the daily cycle as it bottoms, no matter what the weekly cycle is doing. There’s nothing wrong with a 9.7% average gain over a 3-week period. So, if the daily is bottoming, go for the trade. Again, I left money on the table by waiting for the weekly and daily cycles to align.
Learning 3: It is clearly better to have the weekly in alignment with the daily cycle. Returns are significantly larger (15.9% average vs. 9.7% average), and the cycle time is shorter (14.3 days versus 18.3 days). So, when faced with a choice between a stock that has both cycles bottoming in alignment versus one with only the daily bottoming, the choice is clear. All things equal, a higher allocation to the stock with both cycles in alignment is the way to go.
Final Thoughts
So how should I take gains going forward, knowing what I now know? If I wanted just a simple rule, I’d do the following: sell at 7% gain if the daily cycle is out of sync with the weekly cycle, but wait for a 10% gain if the daily cycle is in sync with the weekly. This should give you success most of the time.
If I wanted a somewhat more involved rule, and this is what I actually plan to do, I’d wait for 6% and 9% gain, respectively – a little sooner than the average – then start watching the daily MACD. When it peaks, then I’d sell. Not the entire position at once, necessarily, but at least start legging out. There’s enough variation from one cycle to another, and from one stock to another, that it’s worth giving each one attention as it works its way up the MACD cycle. Unless you prefer to go fishing: then just put in a limit sell order or sell a call on the underlying at the aforementioned 7% (if weekly out of sync) and 10% (if weekly in sync) targets, and you’ll do fine.
Finally, how much money did I leave on the table in 2019? Let’s think it through. The closest proxy to my trading approach would be the Bull Weekly results. Maybe 75% of my trades were done with both MACD cycles in alignment, the other 25% when the weekly and daily were not aligned. Weighting these two together, that’s a 14.4% potential average return per trade. I managed 7%. So it might seem like I left a lot on the table, but this ignores those situations where I jumped from one trade to another (cheaper) one. A better way to look at the lost opportunity is to focus on cash levels. There were times when I had quite a bit of cash. Often 15%, and at one point 40% of the portfolio was in cash. Not for long, only a few weeks. But in hindsight, I should have been more aggressive in keeping down the cash levels, been faster to re-invest, and not been as picky about the daily MACD cycle – whether it was bottoming above or below the equilibrium line, whether it was deep or shallow, or whether the weekly cycle was in alignment. That’s the key takeaway from this study.
I hope you’ve enjoyed this series, and maybe learned a few things. And I hope you’ll visit us at Viking Dividend Income, where we construct Buy and Hold and Actively Traded Model Portfolios based on these principles. Skoal!