


Updated on October 15th, 2019 by Bob Ciura
Spreadsheet data updated daily
Real estate investment trusts – or REITs, for short – can be fantastic securities for generating meaningful portfolio income.
The following downloadable REIT list contains a comprehensive list of U.S. real estate investment trusts along with metrics that matter, including:
- Stock price
- Dividend yield
- Market capitalization
- 5-year beta
Click here to download your Complete REIT Excel Spreadsheet List now. Keep reading this article to learn more.
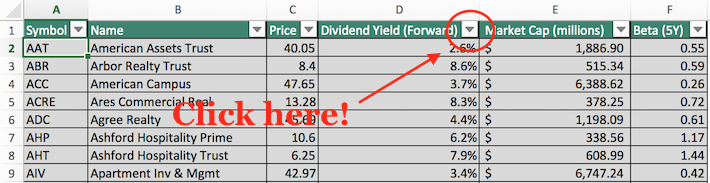
You can view a preview of our REIT spreadsheet below:
| AAT | American Assets Trust, Inc. | 47.06 | 2.4 | 2,810.5 | 60.5 | 142.8 |
| ABR | Arbor Realty Trust, Inc. | 13.20 | 8.1 | 1,245.3 | 9.2 | 74.6 |
| ACC | American Campus Communities, Inc. | 48.26 | 3.8 | 13,262.0 | 79.2 | 303.7 |
| ACRE | Ares Commercial Real Estate Corp. | 15.21 | 8.3 | 439.1 | 11.3 | 94.0 |
| ADC | Agree Realty Corp. | 75.10 | 3.0 | 3,151.7 | 41.5 | 122.6 |
| AHT | Ashford Hospitality Trust, Inc. | 2.77 | 15.2 | 282.9 | -1.5 | -23.0 |
| AIV | Apartment Investment & Management Co. | 53.75 | 2.9 | 8,002.5 | 23.5 | 69.0 |
| AJX | Great Ajax Corp. | 15.51 | 8.1 | 304.8 | 8.8 | 71.9 |
| AKR | Acadia Realty Trust | 28.72 | 3.9 | 2,425.5 | 78.1 | 302.0 |
| ALX | Alexander's, Inc. | 352.93 | 5.1 | 1,802.4 | 33.4 | 170.2 |
| ALEX | Alexander & Baldwin, Inc. | 24.03 | 1.3 | 1,736.0 | -15.0 | -19.4 |
| AMH | American Homes 4 Rent | 26.08 | 0.8 | 7,836.3 | 108.5 | 83.2 |
| AMT | American Tower Corp. | 225.64 | 1.5 | 99,887.4 | 67.8 | 103.6 |
| ANH | Anworth Mortgage Asset Corp. | 3.34 | 15.3 | 329.9 | -3.5 | -52.7 |
| APLE | Apple Hospitality REIT, Inc. | 16.04 | 7.5 | 3,590.9 | 18.5 | 138.3 |
| APTS | Preferred Apartment Communities, Inc. | 14.42 | 7.2 | 653.7 | -9.0 | -64.5 |
| ARE | Alexandria Real Estate Equities, Inc. | 153.87 | 2.5 | 17,540.4 | 43.9 | 110.4 |
| ARI | Apollo Commercial Real Estate Finance, Inc. | 18.86 | 9.8 | 2,895.6 | 11.9 | 116.1 |
| ARR | ARMOUR Residential REIT, Inc. | 16.73 | 13.6 | 985.2 | -1.8 | -24.3 |
| AVB | AvalonBay Communities, Inc. | 218.08 | 2.7 | 30,456.4 | 33.0 | 90.5 |
| BDN | Brandywine Realty Trust | 14.42 | 5.2 | 2,535.2 | 28.9 | 150.2 |
| BFS | Saul Centers, Inc. | 54.19 | 3.9 | 1,246.4 | 30.6 | 119.3 |
| BHR | Braemar Hotels & Resorts, Inc. | 9.02 | 7.1 | 296.8 | -10.1 | -71.4 |
| BRT | BRT Apartments Corp. | 15.51 | 5.2 | 246.6 | -14.5 | -74.9 |
| BRX | Brixmor Property Group, Inc. | 20.53 | 5.4 | 6,114.8 | 17.3 | 93.9 |
| BXMT | Blackstone Mortgage Trust, Inc. | 35.67 | 7.0 | 4,790.1 | 14.3 | 99.8 |
| BXP | Boston Properties, Inc. | 127.57 | 3.0 | 19,718.2 | 37.3 | 111.1 |
| CBL | CBL & Associates Properties, Inc. | 1.42 | 0.0 | 284.3 | -1.4 | 0.0 |
| CCI | Crown Castle International Corp. | 136.13 | 3.3 | 56,596.7 | 78.4 | 254.9 |
| CDR | Cedar Realty Trust, Inc. | 3.36 | 6.0 | 299.2 | 37.0 | 220.5 |
| CHCT | Community Healthcare Trust, Inc. | 45.16 | 3.6 | 876.4 | 343.2 | 1,234.8 |
| CHMI | Cherry Hill Mortgage Investment Corp. | 12.83 | 15.3 | 220.3 | -3.3 | -50.2 |
| CHSP | Chesapeake Lodging Trust | 27.17 | 5.9 | 1,651.0 | 17.4 | 102.4 |
| CIM | Chimera Investment Corp. | 19.88 | 10.1 | 3,720.7 | 21.7 | 218.5 |
| CIO | City Office REIT, Inc. | 13.20 | 7.1 | 523.3 | -33.4 | -238.0 |
| CLDT | Chatham Lodging Trust | 17.45 | 7.6 | 818.8 | 32.5 | 245.9 |
| CLI | Mack-Cali Realty Corp. | 21.67 | 3.7 | 1,962.3 | 8.1 | 29.9 |
| CMO | Capstead Mortgage Corp. | 7.50 | 5.2 | 719.7 | -8.7 | -45.0 |
| COR | CoreSite Realty Corp. | 118.05 | 3.8 | 4,355.0 | 55.2 | 208.2 |
| CORR | CorEnergy Infrastructure Trust, Inc. | 46.42 | 6.5 | 628.1 | 17.4 | 112.4 |
| CPT | Camden Property Trust | 112.71 | 2.8 | 10,913.4 | 68.6 | 191.0 |
| CTT | CatchMark Timber Trust, Inc. | 10.75 | 5.0 | 526.8 | -3.0 | -14.9 |
| CUBE | CubeSmart | 34.67 | 3.6 | 6,672.2 | 37.0 | 134.4 |
| CUZ | Cousins Properties, Inc. | 36.41 | 3.0 | 5,343.6 | 92.2 | 278.6 |
| CXP | Columbia Property Trust, Inc. | 20.21 | 4.0 | 2,362.7 | 115.4 | 456.9 |
| CXW | CoreCivic, Inc. | 15.67 | 11.1 | 1,866.2 | 10.3 | 114.8 |
| DCT | DCT Industrial Trust Inc. | 0.00 | 0.0 | 0.0 | ||
| DDR | DDR Corp. | 0.00 | 0.0 | 0.0 | ||
| DEA | Easterly Government Properties, Inc. | 21.56 | 4.8 | 1,725.0 | 194.1 | 936.1 |
| DEI | Douglas Emmett, Inc. | 42.02 | 2.5 | 8,544.8 | 60.6 | 148.6 |
| DLR | Digital Realty Trust, Inc. | 129.85 | 3.2 | 27,053.3 | 119.0 | 383.0 |
| DOC | Physicians Realty Trust | 17.48 | 5.3 | 3,239.3 | 63.1 | 332.0 |
| DRE | Duke Realty Corp. | 33.35 | 2.5 | 12,159.0 | 51.8 | 131.2 |
| DRH | DiamondRock Hospitality Co. | 9.84 | 5.1 | 1,969.9 | 21.7 | 110.4 |
| DX | Dynex Capital, Inc. | 15.12 | 14.3 | 372.8 | -1.5 | -21.1 |
| EARN | Ellington Residential Mortgage REIT | 10.56 | 12.6 | 131.7 | -651.9 | -8,209.9 |
| EDR | Endeavor Group Holdings, Inc. | 0.00 | 0.0 | 0.0 | ||
| EGP | EastGroup Properties, Inc. | 126.83 | 2.3 | 4,763.7 | 50.7 | 115.2 |
| ELS | Equity LifeStyle Properties, Inc. | 135.45 | 1.7 | 12,330.6 | 45.7 | 78.4 |
| EPR | EPR Properties | 77.30 | 5.7 | 5,995.1 | 22.8 | 130.3 |
| EQC | Equity Commonwealth | 31.02 | 0.0 | 3,782.0 | 7.7 | 0.0 |
| EQR | Equity Residential | 87.58 | 2.5 | 32,479.3 | 50.6 | 128.0 |
| ESRT | Empire State Realty Trust, Inc. | 13.76 | 3.1 | 2,473.1 | 42.3 | 129.2 |
| ESS | Essex Property Trust, Inc. | 327.52 | 2.3 | 21,527.2 | 52.7 | 122.5 |
| EXR | Extra Space Storage, Inc. | 115.24 | 3.0 | 15,607.2 | 33.9 | 102.5 |
| FCPT | Four Corners Property Trust, Inc. | 28.32 | 4.0 | 1,937.6 | 25.7 | 103.3 |
| FPI | Farmland Partners, Inc. | 6.64 | 3.0 | 196.6 | 46.6 | 140.3 |
| FR | First Industrial Realty Trust, Inc. | 39.64 | 2.3 | 5,013.9 | 34.5 | 77.8 |
| FRT | Federal Realty Investment Trust | 135.99 | 3.0 | 10,278.3 | 41.2 | 123.6 |
| GEO | The GEO Group, Inc. | 15.68 | 12.1 | 1,901.2 | 12.0 | 145.9 |
| GGP | 0.00 | 0.0 | 0.0 | |||
| GMRE | Global Medical REIT, Inc. | 11.55 | 6.9 | 454.3 | 31.5 | 218.0 |
| GNL | Global Net Lease, Inc. | 18.97 | 9.4 | 1,602.7 | 155.9 | 1,458.5 |
| GPT | Gramercy Property Trust | 0.00 | 0.0 | 0.0 | ||
| HASI | Hannon Armstrong Sustainable Infrastructure Capital, Inc. | 28.32 | 4.7 | 1,860.3 | 32.3 | 151.8 |
| HCFT | Hunt Companies Finance Trust, Inc. | 3.28 | 8.1 | 77.7 | 35.0 | 283.1 |
| HCP | HCP, Inc. | 36.65 | 4.0 | 17,999.2 | 17.8 | 71.8 |
| HHC | The Howard Hughes Corp. | 122.98 | 0.0 | 5,306.0 | 50.0 | 0.0 |
| HIFR | InfraREIT, Inc. | 21.11 | 4.7 | 928.9 | 14.9 | 70.7 |
| HIW | Highwoods Properties, Inc. | 43.16 | 4.3 | 4,476.7 | 33.6 | 146.1 |
| HR | Healthcare Realty Trust, Inc. | 33.62 | 3.6 | 4,345.2 | 138.9 | 495.7 |
| HST | Host Hotels & Resorts, Inc. | 16.31 | 4.9 | 11,904.7 | 11.0 | 54.0 |
| HT | Hersha Hospitality Trust | 13.84 | 8.1 | 543.5 | -25.8 | -208.6 |
| HTA | Healthcare Trust of America, Inc. | 29.31 | 4.2 | 12,141.7 | 27.8 | 117.8 |
| INN | Summit Hotel Properties, Inc. | 11.88 | 6.1 | 1,248.9 | 13.6 | 82.7 |
| IRET | Investors Real Estate Trust | 74.33 | 6.6 | 955.0 | ||
| IRM | Iron Mountain, Inc. | 32.50 | 7.4 | 9,331.0 | 31.9 | 237.5 |
| IVR | Invesco Mortgage Capital, Inc. | 15.48 | 11.2 | 2,210.6 | -15.3 | -172.2 |
| JCAP | Jernigan Capital, Inc. | 18.91 | 7.4 | 420.5 | 8.4 | 62.2 |
| KIM | Kimco Realty Corp. | 20.77 | 5.4 | 8,769.5 | 25.8 | 139.2 |
| KRC | Kilroy Realty Corp. | 77.70 | 2.4 | 7,844.9 | 28.8 | 68.6 |
| KRG | Kite Realty Group Trust | 16.49 | 7.7 | 1,384.9 | -59.1 | -455.4 |
| LADR | Ladder Capital Corp. | 17.12 | 7.9 | 2,049.8 | 11.8 | 93.0 |
| LHO | LaSalle Hotel Properties | 0.00 | 0.0 | 0.0 | ||
| LPT | Liberty Property Trust | 50.85 | 3.2 | 8,015.3 | 15.8 | 50.4 |
| LSI | Life Storage, Inc. | 107.04 | 3.7 | 4,993.4 | 23.9 | 89.3 |
| LTC | LTC Properties, Inc. | 51.04 | 4.5 | 2,028.9 | 19.0 | 85.0 |
| LXP | Lexington Realty Trust | 10.47 | 5.3 | 2,594.1 | 8.6 | 45.9 |
| MAA | Mid-America Apartment Communities, Inc. | 132.62 | 2.9 | 15,124.5 | 64.0 | 183.5 |
| MAC | Macerich Co. | 27.63 | 10.8 | 4,190.9 | 36.0 | 389.7 |
| MFA | MFA Financial, Inc. | 7.53 | 10.6 | 3,392.7 | 10.7 | 113.4 |
| MGP | MGM Growth Properties LLC | 30.08 | 6.0 | 2,791.4 | 29.7 | 179.2 |
| MNR | Monmouth Real Estate Investment Corp. | 14.42 | 4.7 | 1,376.6 | -379.5 | -1,789.5 |
| MPW | Medical Properties Trust, Inc. | 19.62 | 5.1 | 8,756.3 | 7.5 | 38.2 |
| MRT | MedEquities Realty Trust, Inc. | 11.03 | 5.7 | 351.2 | 200.5 | 1,145.5 |
| NHI | National Health Investors, Inc. | 82.62 | 5.0 | 3,582.5 | 22.9 | 113.7 |
| NLY | Annaly Capital Management, Inc. | 8.67 | 13.3 | 12,625.8 | -2.6 | -34.7 |
| NNN | National Retail Properties, Inc. | 57.03 | 3.5 | 9,788.5 | 40.0 | 140.3 |
| NRE | NorthStar Realty Europe Corp. | 17.02 | 3.5 | 855.9 | 4.7 | 16.5 |
| NRZ | New Residential Investment Corp. | 15.33 | 13.0 | 6,369.9 | 18.3 | 238.4 |
| NSA | National Storage Affiliates Trust | 34.22 | 3.5 | 3,161.8 | -143.8 | -508.4 |
| NXRT | NexPoint Residential Trust, Inc. | 49.03 | 2.2 | 1,175.2 | -65.5 | -143.6 |
| NYRT | New York REIT, Inc. | 0.00 | 0.0 | 0.0 | ||
| O | Realty Income Corp. | 77.97 | 3.4 | 24,812.2 | 59.5 | 204.4 |
| OFC | Corporate Office Properties Trust, Inc. | 28.97 | 3.8 | 3,243.2 | 19.6 | 74.5 |
| OHI | Omega Healthcare Investors, Inc. | 43.02 | 6.1 | 9,390.9 | 33.7 | 206.8 |
| OLP | One Liberty Properties, Inc. | 27.18 | 6.6 | 540.4 | 29.8 | 197.4 |
| ORC | Orchid Island Capital, Inc. | 5.96 | 16.3 | 375.8 | -21.0 | -341.4 |
| OUT | OUTFRONT Media, Inc. | 27.61 | 5.2 | 3,957.7 | 24.6 | 128.1 |
| PEB | Pebblebrook Hotel Trust | 26.60 | 5.7 | 3,474.8 | -66.0 | -377.2 |
| PEI | Pennsylvania Real Estate Investment Trust | 5.14 | 16.3 | 398.6 | -2.9 | -46.7 |
| PGRE | Paramount Group, Inc. | 12.79 | 3.1 | 2,994.3 | 62.5 | 195.5 |
| PLD | Prologis, Inc. | 86.26 | 2.3 | 54,441.2 | 31.8 | 74.5 |
| PMT | PennyMac Mortgage Investment Trust | 22.29 | 8.4 | 1,957.2 | 8.9 | 74.7 |
| PSA | Public Storage | 245.33 | 3.3 | 42,834.1 | 29.2 | 95.4 |
| PSB | PS Business Parks, Inc. | 182.60 | 2.3 | 5,008.9 | 44.8 | 103.1 |
| QTS | QTS Realty Trust, Inc. | 52.60 | 3.2 | 2,915.6 | -610.2 | -1,972.2 |
| RASFD | RAIT Financial Trust | 0.00 | 0.0 | 0.0 | ||
| REG | Regency Centers Corp. | 68.44 | 3.3 | 11,491.5 | 40.0 | 133.1 |
| REXR | Rexford Industrial Realty, Inc. | 45.59 | 1.5 | 5,003.5 | 113.0 | 171.0 |
| RHP | Ryman Hospitality Properties, Inc. | 81.98 | 4.3 | 4,217.3 | 16.2 | 69.0 |
| RLJ | RLJ Lodging Trust | 16.53 | 8.0 | 2,845.4 | 21.2 | 169.2 |
| RPAI | Retail Properties of America, Inc. | 12.79 | 5.2 | 2,732.6 | 41.3 | 213.9 |
| RPT | RPT Realty | 13.65 | 6.4 | 1,094.1 | 92.2 | 594.6 |
| RWT | Redwood Trust, Inc. | 16.56 | 7.2 | 1,856.2 | 12.1 | 87.9 |
| RYN | Rayonier, Inc. | 28.42 | 3.8 | 3,684.1 | 53.2 | 202.3 |
| SKT | Tanger Factory Outlet Centers, Inc. | 15.54 | 9.0 | 1,453.7 | 20.0 | 181.1 |
| SLD | Sutherland Asset Management Corporation | 0.00 | 0.0 | 0.0 | ||
| SLG | SL Green Realty Corp. | 80.45 | 4.2 | 6,973.1 | 29.1 | 121.7 |
| SNR | New Senior Investment Group, Inc. | 6.82 | 7.6 | 566.9 | -4.3 | -33.1 |
| SPG | Simon Property Group, Inc. | 148.65 | 5.4 | 98,529.1 | 21.2 | 115.6 |
| STAG | STAG Industrial, Inc. | 30.20 | 4.7 | 4,135.2 | ||
| STAR | iStar, Inc. | 12.87 | 2.9 | 800.1 | 3.8 | 11.0 |
| STOR | STORE Capital Corp. | 37.60 | 3.5 | 8,684.8 | 37.9 | 133.2 |
| STWD | Starwood Property Trust, Inc. | 24.21 | 7.9 | 6,814.7 | 17.9 | 142.3 |
| SUI | Sun Communities, Inc. | 152.59 | 1.9 | 13,835.5 | 100.4 | 192.1 |
| TCI | Transcontinental Realty Investors, Inc. | 29.34 | 0.0 | 255.8 | 1.6 | 0.0 |
| TCO | Taubman Centers, Inc. | 36.56 | 7.3 | 2,237.8 | 49.4 | 359.6 |
| TIER | TIER REIT, Inc. | 28.88 | 2.5 | 1,603.4 | -56.4 | -140.5 |
| TWO | Two Harbors Investment Corp. | 13.33 | 13.6 | 3,637.8 | -4.7 | -64.3 |
| UBA | Urstadt Biddle Properties, Inc. | 23.79 | 4.6 | 948.2 | 37.9 | 174.4 |
| UBP | Urstadt Biddle Properties, Inc. | 18.69 | 5.9 | 744.9 | 30.5 | 178.8 |
| UDR | UDR, Inc. | 48.51 | 2.7 | 23,129.3 | 84.5 | 231.7 |
| UHT | Universal Health Realty Income Trust | 104.23 | 2.6 | 1,433.9 | 82.9 | 214.7 |
| UMH | UMH Properties, Inc. | 14.30 | 5.0 | 578.2 | -12.3 | -61.9 |
| VER | VEREIT, Inc. | 9.70 | 5.7 | 10,356.6 | 39.7 | 225.0 |
| VNO | Vornado Realty Trust | 62.19 | 4.1 | 11,866.7 | 4.1 | 17.1 |
| VTR | Ventas, Inc. | 72.65 | 4.4 | 27,068.3 | 52.1 | 227.0 |
| WELL | Welltower, Inc. | 91.79 | 3.8 | 37,197.6 | 102.2 | 387.5 |
| WMC | Western Asset Mortgage Capital Corp. | 9.81 | 12.6 | 522.1 | 10.7 | 135.7 |
| WPC | W.P. Carey, Inc. | 90.48 | 4.6 | 15,452.8 | 31.9 | 145.4 |
| WPG | Washington Prime Group, Inc. | 3.89 | 25.7 | 725.8 | 21.7 | 558.7 |
| WRI | Weingarten Realty Investors | 28.94 | 5.5 | 3,723.7 | 16.9 | 92.3 |
| WSR | Whitestone REIT | 13.62 | 8.4 | 548.0 | 29.9 | 250.4 |
| WY | Weyerhaeuser Co. | 27.17 | 5.0 | 20,239.7 | 5,906.5 | 29,565.2 |
| XAN | Exantas Capital Corp. | 11.28 | 6.6 | 359.5 | 14.0 | 93.0 |
| Ticker | Name | Price | Dividend Yield | Market Cap ($M) | P/E Ratio | Payout Ratio |
How To Use The REIT List To Find Dividend Stock Ideas
REITs give investors the ability to experience the economic benefits associated with real estate ownership without the hassle of being a landlord in the traditional sense.
Because of the monthly rental cashflows generated by REITs, these securities are well-suited to investors that aim to generate income from their investment portfolios. Accordingly, dividend yield will be the primary metric of interest for many REIT investors.
For those unfamiliar with Microsoft Excel, the following images show how to filter for REITs with dividend yields between 5% and 7% using the ‘filter’ function of Excel.
Step 1: Download the Complete REIT Excel Spreadsheet List at the link above.
Step 2: Click on the filter icon at the top of the ‘Dividend Yield’ column in the Complete REIT Excel Spreadsheet List.
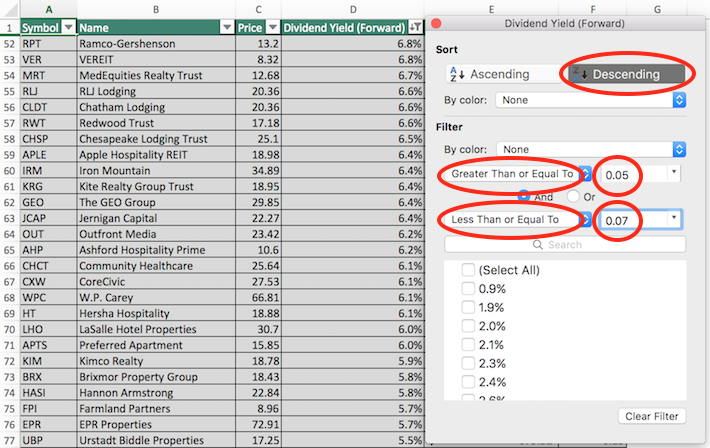
Step 3: Use the filter functions ‘Greater Than or Equal To’ and ‘Less Than or Equal To’ along with the numbers 0.05 ad 0.07 to display REITs with dividend yields between 5% and 7%.
This will help to eliminate any REITs with exceptionally high (and perhaps unsustainable) dividend yields.
Also, click on ‘Descending’ at the top of the filter window to list the REITs with the highest dividend yields at the top of the spreadsheet.
Now that you have the tools to identify high-quality REITs, the next section will show some of the benefits of owning this asset class in a diversified investment portfolio.
Why Invest in REITs
REITs are, by design, a fantastic asset class for investors looking to generate income.
Thus, one of the primarily benefits of investing in these securities is their high dividend yields.
The currently high dividend yields of REITs is not an isolated occurrence. In fact, this asset class has traded at a higher dividend yield than the S&P 500 for decades.
This trend is shown below.
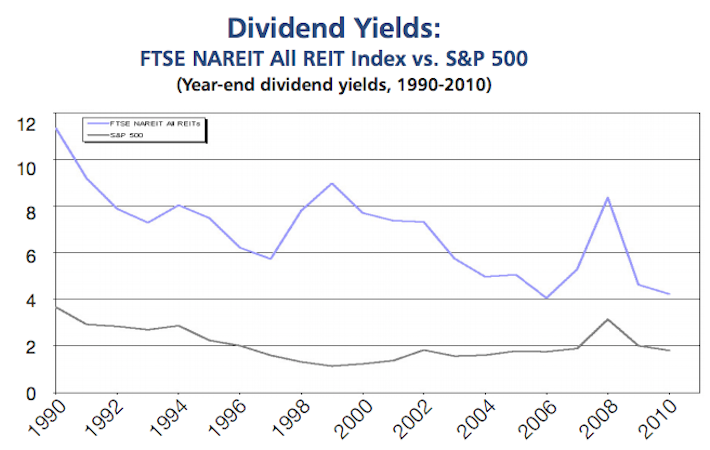
Source: NAREIT: The Investor’s Guide to REITs
The high dividend yields of REITs are due to the regulatory implications of doing business as a real estate investment trust.
In exchange for listing as a REIT, these trusts must pay out at least 90% of their net income as dividend payments to their unitholders (REITs trade as units, not shares).
Sometimes you will see a payout ratio of less than 90% for a REIT, and that is likely because they are using funds from operations, not net income, in the denominator for REIT payout ratios (more on that later).
One might think that the high payout ratios of REITs would result in inferior total return performance compared to their peers (even though they have high dividend yields).
This is not the case.
In fact through the 20-year period ending in 2016, REITS – as measured by the MSCI U.S. REIT Index – actually outperformed the broader stock market as measured by the S&P 500 Index.
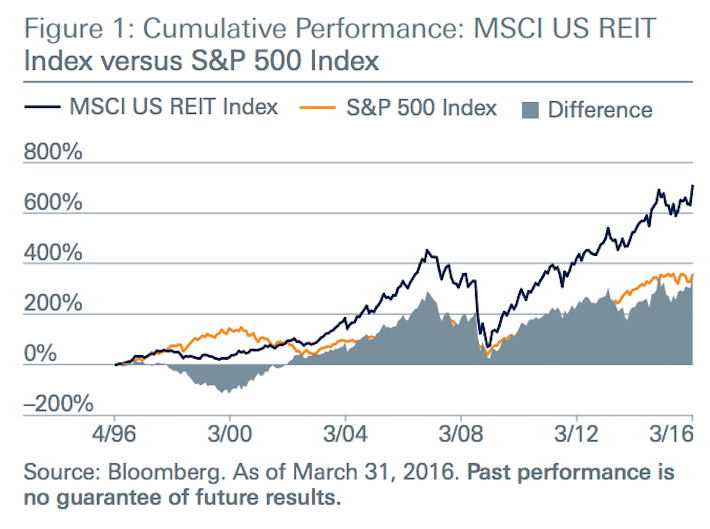
Source: Deustche Asset Management: The Basic of Listed Real Estate Investing
REIT Financial Metrics
REITs run unique business models.
More than the vast majority of other business types, they are primarily involved in the ownership of long-lived assets.
From an accounting perspective, this means that REITs incur significant non-cash depreciation and amortization expenses.
How does this effect the bottom line of REITs?
Depreciation and amortization expenses reduce a company’s net income, which means that sometimes a REIT’s dividend will be higher than its net income, even though its dividends are safe based on its cash flow.
To give a better sense of financial performance and dividend safety, REITs eventually developed the financial metric funds from operations, or FFO. Just like earnings, FFO can be reported on a per-unit basis, giving FFO/unit – the rough equivalent of earnings-per-share for a REIT.
FFO is determined by taking net income and adding back various non-cash charges that are seen to artificially impair a REIT’s perceived ability to pay its dividend.
For an example of how FFO is calculated, consider the following net income-FFO reconciliation from a recent earnings release of Realty Income (O), one of the largest and most popular REIT securities.

Source: Realty Income Earnings Release
In this quarter, net income per unit was $0.39 per share while FFO per unit was $0.81, a sizable difference between the two metrics. This shows the profound effect that depreciation and amortization can have on the GAAP financial performance of real estate investment trusts.
The Top 10 REITs Today
In addition to the full downloadable Excel spreadsheet, this article covers our top 10 REITs today, as ranked using expected total returns from The Sure Analysis Research Database.
The top 10 list is ranked by 5-year expected total returns, in order of lowest to highest. The table of contents below allows for easy navigation.
- Service Properties Trust (SVC)
- Simon Property Group (SPG)
- ARMOUR Residential (ARR)
- AGNC Investment Corp. (AGNC)
- Dynex Capital (DX)
- Taubman Centers (TCO)
- Brookfield Property Partners (BPY)
- Brookfield Property REIT (BPR)
- Tanger Factory Outlets (SKT)
- Macerich Company (MCO)
Top REIT #10: Service Properties Trust (SVC)
- 5-Year Expected Annual Return: 12.8%
Service Properties Trust owns hotels and retail-focused lease properties. Service Properties Trust owns properties in the U.S., Canada, and Puerto Rico. The REIT, which was originally named Hospitality Properties Trust, changed its name and ticker symbol when it acquired the retail portfolio of Spirit MTA REIT in September 2019.
The company reported steady growth for the past several years of its existence as HPT.
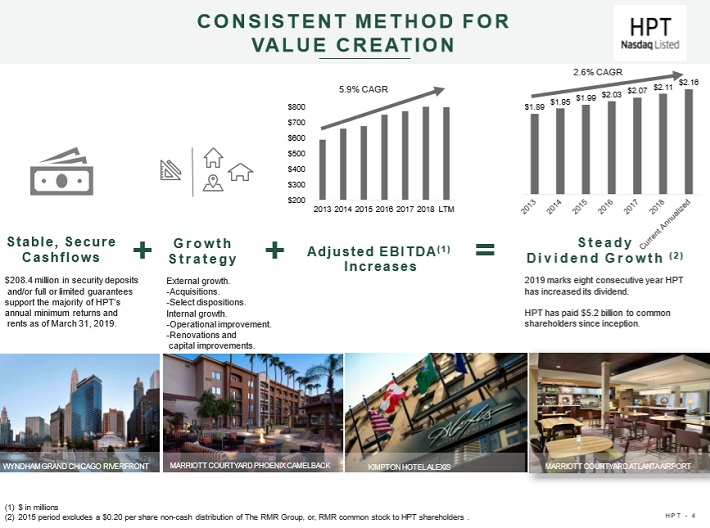
Source: Investor Presentation
Service Properties Trust reported its second quarter earnings results on August 9th. The trust achieved revenues of $611 million during the quarter, which was 0.2% less than the revenues that Service Properties Trust generated during the previous year’s quarter.
Funds from operations of $169 million declined from $176 million during the previous year’s quarter. Funds from operations hit $1.03 on a per-share basis, down 4% versus the previous year’s quarter. Revenue per available room, a standard metric for hotel REITs, was down 2.1% year over year. The REIT also announced that it would exit its relationship with Wyndham, a tenant Service Properties Trust has had problems with in the past. The affected hotels will be rebranded or sold.
Higher occupancy rates, and higher rents on a same-property basis due to the positive impact of renovations, will have a positive impact on Service Properties Trust’s future growth. The healthy economy benefits business travel, and also allows consumers to increase their travel spending.
Management believes that the acquisition of the Spirit retail portfolio will have a positive impact on its results as well, although investors should expect some one-time expenses during the first couple of quarters following the close of the acquisition, until the portfolio is fully integrated. Service Properties Trust faces headwinds as well, such as a weak coverage of minimum returns and rents for its hotels.
Service Properties Trust cut its dividend by roughly 75% during the last financial crisis, and the current payout is still lower than the pre-crisis dividend. Service Properties Trust is working with several major, renowned hotel companies, including Marriott, InterContinental, Hyatt, and Radisson.
Due to the negative impact of major recessions on business travel, as well as on personal travel, Service Properties Trust is not immune to recessions. The REIT’s FFO-per-share declined by roughly 25% during the last financial crisis. Investors thus should not assume that the REIT’s dividend is overly safe in a lengthy recession.
Based on 2019 expected FFO-per-share of $3.75, the stock has a P/FFO ratio of 6.7. Our fair value estimate is a P/FFO ratio of 7.5. Expansion of the valuation multiple could boost annual returns by 2.3% per year. In addition to 1.9% expected annual FFO growth and the 8.6% dividend yield, total returns are expected to reach 12.8% per year through 2024.
Top REIT #9: Simon Property Group (SPG)
- 5-Year Expected Annual Return: 13.6%
Simon Property Group focuses on retail properties, mainly in the U.S., with the goal of being the premier destination for high-end retailers and their customers. The trust has interests in about 230 different properties that amount to nearly 200 million square feet of leasable space. Simon produces about $5.8 billion in annual revenue and has a market capitalization of $53 billion.
Simon reported Q2 earnings on 7/31/19. Revenue was up 0.64% year-over-year, beating expectations by $7.4 million, while FFO per share of $2.99 rose 4.9% year-over-year. Simon reported comparable NOI growth of 2.0%, a healthy occupancy rate of 94.4%, and leasing spread per square foot growth of 32% for the trailing twelve months.
Redevelopment projects continued to make good progress as well and should continue to fuel solid cash flow growth in the quarters to come. These results led management to reaffirm full-year guidance of $12.35 at the midpoint.
Simon has diversified sources of NOI.
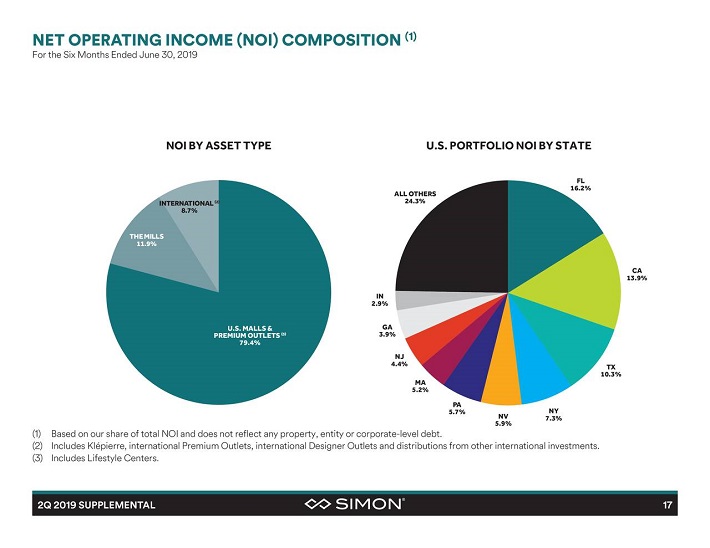
Source: Earnings Slides
We see Simon producing a ~3% average annual FFO growth rate moving forward. Recent years have seen a growth rate roughly double that at 6%, but given Simon’s already-dominant position in the retail sector, the unstoppable rise of e-commerce crimping demand for physical stores, and how mature the current economic cycle is, it looks like Simon and other retail REITs will have a harder time with future FFO growth. Guidance for 2019 would seem to support this thesis.
That said, Simon is still the best retail REIT in the market by many metrics. Its occupancy rates remain extremely high, hovering around 96% in recent quarters. It also charges more than $54 per square foot on average, which is tremendously high for retail space. Simon has built a niche with high-end retailers over the years such that it has the most desirable spaces and developments, and thus sees a virtuous combination of high occupancy and leasing rates.
Simon’s competitive advantage is in its world-class portfolio of properties that allows it to charge industry-best leasing rates. Another advantage is its low cost of capital that comes from its A-rated balance sheet, enabling it to invest in ways that competitors cannot afford to.
It is not immune to recession as it did cut its dividend during the last downturn. However, despite the cut, its overall business held up fairly well during that period should be able to again. It is also one of the best positioned retail REITs to weather the impact of e-commerce on bricks-and-mortar retail stores.
Based on 2019 expected FFO-per-share of $12.35, the stock has a P/FFO ratio of 12.1. Our fair value estimate is a P/FFO ratio of 15.5. Expansion of the valuation multiple could boost annual returns by 5.1% per year. In addition to 3.0% expected annual FFO growth and the 5.5% dividend yield, total returns are expected to reach 13.6% per year through 2024.
Top REIT #8: ARMOUR Residential REIT (ARR)
- 5-Year Expected Annual Return: 14.0%
ARMOUR Residential is a mortgage REIT that was formed in 2008. The trust invests primarily in residential mortgage-backed securities that are guaranteed or issued by a United States government entity including Fannie Mae, Freddie Mac and Ginnie Mae. ARMOUR has a $1 billion market capitalization and produces about $165 million in annual revenue.
ARMOUR reported Q2 earnings on 7/24/19. Core income per share came in at 63 cents, well ahead of analyst average estimates of 58 cents. Shareholders experienced a -1% economic return during the quarter as stockholder equity declined more than the dividend payments. However, since the end of the quarter, book value per share had rebounded by 1% to $20.71 per share. At quarter end, ARMOUR had $14.4 billion of securities, including $595.4 million in cash and unpledged securities, $7.6 billion in interest rate swaps, $0.8 billion in Credit Risk and Non-Agency securities.
The trust also fully covered its dividend with core income for the 12th straight quarter, and repurchased 625,000 common shares to capitalize on the discount to book value. The dividend is covered by cash flow and we foresee that continuing indefinitely.
ARMOUR is not beholden to recessions so much as it is rates. However, long-term rates tend to move down in a recession, which would make it less attractive for mREITs to purchase more securities. That, in turn, would crimp balance sheet growth and thus, the outlook for cash flow growth.
ARMOUR’s valuation has moved around a lot in recent years. With cash flow declining of late, the valuation has moved significantly higher. We are valuing the stock based on cash flow per share. The stock has a current price-to-cash flow ratio of 6.6, compared with our fair value at 8 times cash flow given that the yield is well-supported by cash flow. Thus, we see a 3.9% annual boost to total returns from the valuation expansion moving forward.
Valuation expansion will offset a 2% expected annual decline in cash flow per share over the next five years. In addition to the high dividend yield of 12.1%, ARMOUR has total expected returns of 14% per year through 2024.
Top REIT #7: AGNC Investment Corp. (AGNC)
- 5-Year Expected Annual Return: 14.2%
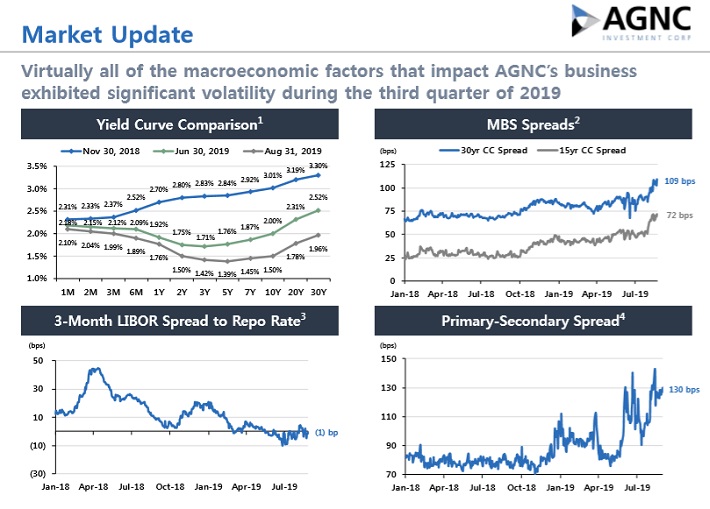
American Capital Agency Corp is a monthly dividend stock, meaning it pays a dividend each month. AGNC is a mortgage real estate investment trust that invests primarily in agency mortgage-backed securities (or MBS) on a leveraged basis.
Its asset portfolio is comprised of residential mortgage pass-through securities, collateralized mortgage obligations (or CMO), and non-agency MBS. Many of these are guaranteed by government-sponsored enterprises. The majority of American Capital’s investments are fixed-rate agency MBS. Most of these are MBS with a 30-year maturity period.
The counterparties to most of American Capital’s assets are located in North America. Counterparties in Europe also represent a significant percentage of the trust’s total portfolio. American Capital derives nearly all its revenue in the form of interest income. It currently generates about $229 million in annual revenue and trades at a market capitalization of $9 billion.
Source: Investor Presentation
The trust reported Q2 results on July 24th. Net spread and dollar roll income per common share for the quarter (excluding estimated catch-up premium amortization cost) of $0.49. This was down 5.8% year-over-year, reflecting the negative impacts of elevated MBS repo funding rates, as well as increased amortization expense stemming from higher projected lifetime prepayments speeds.
While the trend is not encouraging, management is optimistic that results will stabilize as the rapid growth in prepayments is simply the result of the dramatic drop in interest rates.
Given that it had its IPO in 2008 – in the midst of the financial crisis – it is hard to get an accurate picture of exactly how it can be expected to perform in the next recession. However, the mortgage backed security industry – given its leverage and interest rate sensitivity – is very prone to underperform when the housing market experiences a downturn and mortgage foreclosures rise. As a result, it should not be viewed as a safe defensive stock for a recession.
Based on 2019 expected EPS of $2.26, the stock has a P/E ratio of 7.2. Our fair value estimate is a P/E ratio of 8. Expansion of the valuation multiple could boost annual returns by 2.1% per year. In addition to 0.4% expected annual EPS growth and the 11.7% dividend yield, total returns are expected to reach 14.2% per year through 2024.
Top REIT #6: Dynex Capital, Inc. (DX)
- 5-Year Expected Annual Return: 14.2%
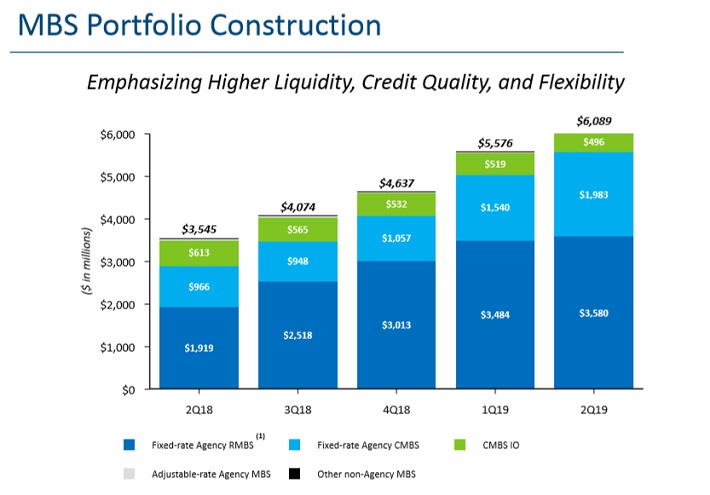
Dynex Capital, Inc. is a mortgage REIT and invests in mortgage-backed securities (MBS) on a leveraged basis in the United States. It invests in agency and non-agency MBS consisting of residential MBS, commercial MBS (CMBS), and CMBS interest-only securities. Agency MBS have a guaranty of principal payment by an agency of the U.S. government or a U.S. government-sponsored entity, such as Fannie Mae and Freddie Mac. Non-Agency MBS have no such guaranty of payment.
Source: Investor Presentation
The trust reported first quarter results on July 31st. Core net operating income was $0.43 per common share was down 19% from $0.53 per common share in the previous quarter. This led to a fairly rapid decline in book value per common share, from $18.71 as of March 31st to $17.68 at the end of June. Net interest spread and adjusted net interest spreads tightened to 0.76% and 1.03%, respectively, from 0.84% and 1.19%, respectively, in the previous quarter.
Given that interest rates are expected to remain in a narrower and lower range for a longer period than ever seen in recent history, growth will likely suffer substantially. This is because the global economy will continue to be weighed down by large pools of negative yielding debt, forcing central banks to remain accommodative in their monetary policy. That said, Dynex still benefits from several long-term factors.
As the Federal Reserve attempts to reduce its investment in Agency RMBS and GSE reform opens new investment opportunities, demand for private capital in the US housing finance system should grow. Also, the shortage of affordable housing means that there is a need for additional investment into the sector. Taking into account these headwinds and tailwinds along with the trust’s high payout ratio, we do not expect any earnings-per-share growth over the next half decade.
Based on 2019 expected EPS of $2.16, the stock has a P/E ratio of 7.1. Our fair value estimate is a P/E ratio of 8. Expansion of the valuation multiple could boost annual returns by 2.4% per year. In addition to 0% expected annual FFO growth and the 11.8% dividend yield, total returns are expected to reach 14.2% per year through 2024.
Top REIT #5: Taubman Centers, Inc. (TCO)
- 5-Year Expected Annual Return: 15.0%
Taubman Centers is a retail REIT that acquires, develops, owns, and operates high-grade malls and shopping centers in the United States (including Puerto Rico), as well as in China and South Korea. Taubman Centers is focused on the upper end of the quality spectrum of U.S. malls and shopping centers. Taubman Centers is trading with a market capitalization of $3.2 billion.
Taubman Centers has a high-quality property portfolio.
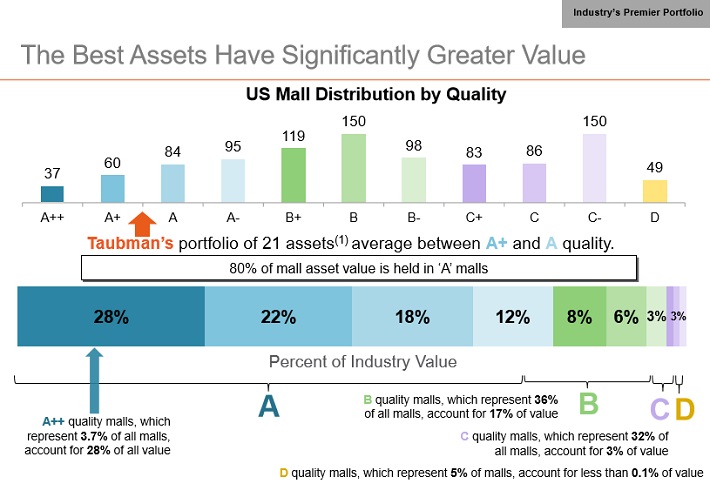
Source: Investor Presentation
Taubman Centers reported its second quarter earnings results on July 25th. The trust generated revenues of $162 million during the second quarter, up 5.8% from the previous year’s quarter.
Adjusted funds from operations increased 8% year over year. Taubman Centers’ sales per square foot, average rents, and portfolio operating income were all up compared to the previous year’s quarter, which shows that its high-quality assets are withstanding the Amazon (AMZN) threat. Taubman Centers raised its guidance for this year’s adjusted funds from operations to $3.64 – $3.74 on a per-share basis.
Taubman Centers has one of the highest-quality portfolios among mall REITs. This has allowed for above-average rent growth, and leads to compelling same center net operating income. The company expects that its same-center net operating income will rise by 2% during fiscal 2019.
Another growth catalyst is the company’s malls in China and Korea, where retail sales are growing at a stronger pace than in the U.S. This allows for above-average growth in rents and net operating income. Due to the fact that there is not a lot of retail space in these countries, Taubman Centers has the potential to grow its asset base in China and Korea further.
We believe Taubman’s dividend is secure, as the company has a projected FFO payout ratio of 73% for 2019.
Taubman Centers was negatively impacted during the last financial crisis to a significant degree, which is not surprising, as the trust has indirect exposure to consumer spending through the impact on its tenants. Taubman Centers remained profitable, though, and the trust recovered quickly and was able to raise the dividend again shortly after the financial crisis. Future harsh recessions could impact Taubman Centers to a significant degree, and could push the trust’s payout ratio above 100%, such as in 2008.
Based on 2019 expected FFO-per-share of $3.69, the stock has a P/FFO ratio of 9.9. Our fair value estimate is a P/FFO ratio of 13.0. Expansion of the valuation multiple could boost annual returns by 5.6% per year. In addition to 2% expected annual FFO growth and the 7.4% dividend yield, total returns are expected to reach 15% per year through 2024.
Top REIT #4: Brookfield Property Partners (BPY)
- 5-Year Expected Annual Return: 18.0%
Brookfield Property Partners L.P. is a diversified global real estate company that owns, operates, and develops one of the largest portfolios of office, retail, multifamily, industrial, and student housing assets. Brookfield Property Partners is one of four publicly-traded partnerships that is operated by Brookfield Asset Management (BAM). Brookfield Property Partners trades with a market capitalization of $8.5 billion.

Source: Investor Presentation
BPY reported its Q2 results on August 5th. The company reported funds from operations (FFO) along with realized gains totaling $362 million, an increase of 45% against the comparable quarter in 2018. On a per-unit basis, it was a 5.6% increase year over year. BPY’s Core Office portfolio remained stable, generating 3% same-property net operating income (NOI) growth and ending the quarter with an occupancy of 92.4%.
BPY has been working through some hiccups with its Core Retail portfolio. Specifically, due to recent bankruptcies for some of its previous clients, same-store NOI rose 0.4% in Q2 and 1.7% for the first half of the year. At the end of Q2, the Core Retail portfolio was 95% leased, and BPY expects an improvement to 96% by year end.
Since it was spun off from BAM in 2013, BPY has compounded its FFOPS at a rate of 6.3% per year (2012 to 2018). Looking ahead, we believe that BPY’s global reach and real estate expertise will allow it to continue growing at a similar pace moving forward. In the near term, the growth of BPY will be tethered to the takeover of General Growth Properties. This transaction closed during August 2018.
BPY benefits from numerous competitive advantages as a part of the Brookfield family of companies. Specifically, it has access to large-scale capital, a global operating presence, and a world-class management team. Its recession performance is unknown because of its short history trading as a standalone company. BPY has heavy exposure to the cyclical office and retail sectors. Therefore, we expect a noticeable dip in cash flows during a recession which might result in a dividend freeze.
Based on 2019 expected FFO-per-share of $1.56, the stock has a P/FFO ratio of 12.4. Our fair value estimate is a P/FFO ratio of 16. Expansion of the valuation multiple could boost annual returns by 5.2% per year. In addition to 6% expected annual FFO growth and the 6.8% dividend yield, total returns are expected to reach 18% per year through 2024.
Top REIT #3: Brookfield Property REIT (BPR)
- 5-Year Expected Annual Return: 18.7%
Brookfield Property REIT (BPR) is a subsidiary of Brookfield Property Partners (BPY) and their parent company Brookfield Asset Management (BAM). BPR was created in July 2018 upon completion of the acquisition of U.S. mall owner General Growth Properties (GGP) for $9.35 billion. Shares are aligned with parent company BPY, which controls 82% of outstanding units and offers a matching dividend payment plus the opportunity to convert existing BPR shares into BPY shares on a 1 to 1 basis over the next 20 years.
With a market cap of $1.4 billion, the assets are primarily comprised of Class-A U.S. shopping malls. However, they operate under the umbrella of BPY, which owns and operates premium real estate holdings around the world including multi-unit housing, office towers, retail and industrial properties.
BPR is managed by some of the best real estate managers in the world and operates under a unique business model that sees them owning, operating, developing and recycling premium assets purchased on a value basis.
The combination of GGP’s asset base and Brookfield’s capital and development expertise has created a significant opportunity for BPR in the coming years. The company focuses on growth by developing opportunities within its existing footprint, including refurbishing or repositioning retail properties.
BPR targets 12-15% total returns for shareholders, and we believe the company is capable of meeting this objective over the next 5 years from a combination of a generous high yield of about 6.3% and the targeted dividend growth of 5-8% per year.
Although the payout ratios have remained high in the 80-90% range historically, the actual payout ratios were 65% or lower since 2016, when accounting for asset sales, which imply a safer dividend than viewed on the surface. With the nature of their assets being premium real estate properties, we expect the stock to continue to generate stable cash flow and dividends even in the event of a recession as cash flows are tied to long-term leases in place with Class-A tenants.
Based on 2019 expected FFO-per-share of $1.57, the stock has a P/FFO ratio of 12.3. Our fair value estimate is a P/FFO ratio of 16.4. Expansion of the valuation multiple could boost annual returns by 5.9% per year. In addition to 6% expected annual FFO growth and the 6.8% dividend yield, total returns are expected to reach 18.7% per year through 2024.
Top REIT #2: Tanger Factory Outlets (SKT)
- 5-Year Expected Annual Return: 23.4%
Tanger operates, owns, or has an ownership stake in a portfolio of 40 shopping centers. Properties are located in Canada and 20 U.S. states, totaling approximately 14.4 million square feet, leased to over 500 different tenants.
Tanger’s diversified base of high-quality tenants has led to steady growth for many years.

Source: Earnings Slides
Tanger released 2019 second-quarter results on July 31st. It announced adjusted funds from operations (FFO) of $0.57 per share, a decrease of 5% compared with $0.60 per share in the same quarter last year. Tanger grew its occupancy by 60 basis points from the previous quarter, to 96%. Another positive note was that traffic increased 2.3% for the quarter.
Occupancy is expected to decline somewhat in 2019 to a range of 94.0% to 94.5%, due to anticipated store closures by certain tenants. Fortunately, the company has maintained an occupancy rate of 95%+ for 25 consecutive years.
The dip in occupancy this year will negatively impact the company’s AFFO, but Tanger will still be able to cover its hefty dividend payment.
Tanger’s 9.8% dividend yield is clearly attractive for income investors. The biggest concern with a yield this high is sustainability. Fortunately, Tanger appears to have a secure dividend payout.
Tanger could fare relatively well in a recession, compared to other REITs. Tanger went through the Great Recession virtually unscathed as AFFO fell only 2.2% from 2008 to 2010. Outlet centers provide good value for the cost and so this industry should see similar or growing foot traffic and earnings when the population tightens their purse strings.
We expect Tanger will generate AFFO-per-share of $2.25 for 2019. With an expected dividend payout of $1.47 per share, Tanger’s expected 2019 dividend payout ratio is 65%. This is a manageable payout ratio, which leaves room for modest annual hikes. For example, in February Tanger raised its dividend by 1.4%.
Based on 2019 expected FFO-per-share of $2.25, the stock has a P/FFO ratio of 7.0. Our fair value estimate is a P/FFO ratio of 11.5. Expansion of the valuation multiple could boost annual returns by 10.4% per year. In addition to 4% expected annual FFO growth and the 9.0% dividend yield, total returns are expected to reach 23.4% per year through 2024.
Top REIT #1: Macerich Company (MAC)
- 5-Year Expected Annual Return: 24.2%
Macerich Company is one of the country’s leading owners, operators, and developers of major retail real estate. The company is incorporated as a real estate investment trust (REIT) and owns 51 million square feet of real estate consisting primarily of interests in 47 regional shopping centers. The company has a significant presence in the West Coast, Arizona, Chicago, and the Metro New York to Washington, DC corridor.
Macerich has a long history of steady growth.
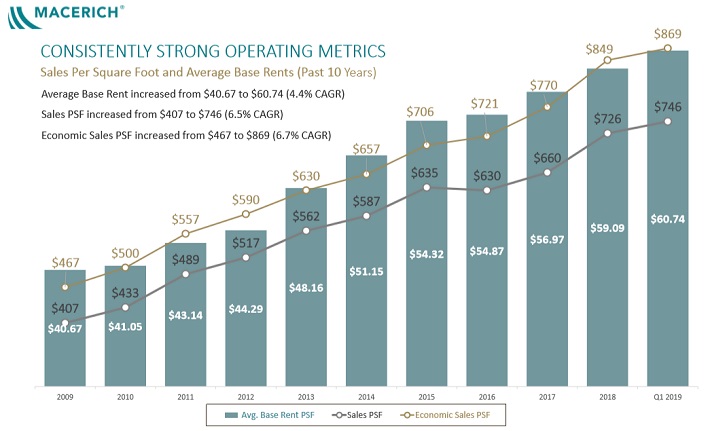
Source: Investor Presentation
In early August, Macerich reported (8/1/19) financial results for the second quarter of fiscal 2019. Funds from operations per share (FFOPS) rose from $0.83 in last year’s quarter to $0.88 thanks to positive performance on a number of important operating metrics.
Mall tenant annual sales per square foot increased 12.1% year-over-year, while re-leasing spreads (the difference between rent per square foot on a new lease compared to the rent that was previously paid for the same space) expanded by 9.4%. The company ended the quarter with average rent per square foot up by 4.0% over last year’s quarter, though mall portfolio occupancy slightly decreased, from 94.3% in last year’s quarter to 94.1%.
Macerich continues its efforts to redevelop the properties it has recaptured from Sears. While this process will eventually improve the cash flows of Macerich, it will continue to have a negative effect on the results of the REIT over the next several years.
Management reiterated its past guidance for funds from operations of $3.50-$3.58 for 2019. With an annualized dividend payout of $3.00 per share, Macerich is expected to generate more than enough FFO to maintain its dividend payout.
Based on 2019 expected FFO-per-share of $3.60, the stock has a P/FFO ratio of 7.6. Our fair value estimate is a P/FFO ratio of 13. Expansion of the valuation multiple could boost annual returns by 11.3% per year. In addition to 2% expected annual FFO growth and the 10.9% dividend yield, total returns are expected to reach 24.2% per year through 2024.
Final Thoughts
The Complete REIT Spreadsheet List contains a list of all publicly-traded real estate investment trusts.
Bonus: Listen to our interview with Brad Thomas on The Sure Investing Podcast about intelligent REIT investing in the below video.
However, this database is certainly not the only place to find high-quality dividend stocks trading at fair or better prices.In fact, one of the best methods to find high-quality dividend stocks is looking for stocks with long histories of steadily rising dividend payments. Companies that have increased their payouts through many market cycles are highly likely to continue doing so for a long time to come.
You can see more high-quality dividend stocks in the following Sure Dividend databases, each based on long streaks of steadily rising dividend payments:
- The 2017 Dividend Kings List: Dividend Stocks With 50+ Years of Rising Dividends
- The 2017 Dividend Aristocrats List: 25+ Years of Rising Dividends
- The 2017 List of All 264 Dividend Achievers
Alternatively, another great place to look for high-quality business is inside the portfolios of highly successful investors. By analyzing the portfolios of legendary investors running multi-billion dollar investment portfolios, we are able to indirectly benefit from their million-dollar research budgets and personal investing expertise.
To that end, Sure Dividend has created the following stock databases:
- Warren Buffett’s Top 20 Stocks
- Seth Klarman’s Top 5 High Dividend Stocks
- Joel Greenblatt’s Top 20 High Dividend Stocks
- Bill Gates’ Stock Portfolio: Every Holding Analyzed
- Prem Watsa’s Dividend Stock Portfolio: Every Holding Analyzed
You might also be looking to create a highly customized dividend income stream to pay for life’s expenses.
The following two lists provide useful information on high dividend stocks and stocks that pay monthly dividends: